What is the status of Antarctica’s ice sheets?

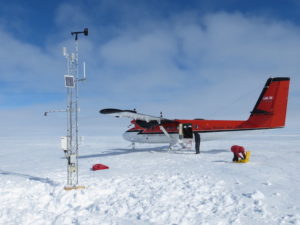
The Antarctic Meteorological Research Center (AMRC) at the UW-Madison’s Space Science and Engineering Center (SSEC) maintains 57 Automated Weather Stations (AWS) in Antarctica. In the photo, Elina Valkonen and David Mikolajczyk travel by Twin Otter aircraft to service a remote weather station.
(Photo credit: AMRC)

Most of Antarctica is covered by ice.

The ice sheet is over 2 miles thick in places and in some places the ice sheet bottom is almost a mile below sea level. This massive ice covers mountain ranges, and volcanoes exist underneath the sheets.

The Antarctic Ice Sheet is categorized as three ice sheets: the Antarctic Peninsula Ice Sheet, the West Antarctic Ice Sheet and the East Antarctic Ice Sheet.

The Antarctic Ice Sheet currently discharges 90 percent of ice and sediment through corridors of fast-flowing ice within an ice sheet known as ice streams. Ice streams are typically large features, greater than 25 miles in width, and longer than 90 miles. Today, ice streams drain the Antarctic continent, with tributary glaciers reaching hundreds of miles inland.

Overall, recent estimates indicate that over a 19-year survey, Antarctic’s net ice mass is decreasing. Satellite observations measured a widespread enhanced flow toward the ocean, with tributary glaciers reaching deep into Antarctica’s interior.

Antarctica drains more than 80 percent of its ice sheet through floating ice shelves. In recent years we have seen the collapse and melting of these ice shelves. In 2002, satellite imagery captured the collapse of the entire 1,250-square-mile Larsen B Ice Shelf. The disintegration of this Antarctic Peninsula ice sheet was rapid.

New observations indicate that glaciers in East Antarctic have begun to melt. Scientists have long considered these glaciers to be more stable than those in West Antarctica. Glaciers around the West Antarctic Ice Sheet are currently thinning. The Antarctic Peninsula Ice Sheet is changing most rapidly.

Category: Climate, Meteorology, Seasons

Comments Off on What is the status of Antarctica’s ice sheets?

Can weather in the stratosphere affect us near the ground?

Thus far the winter has been relatively mild around the Northern Hemisphere. This December was the 14th-warmest December, and the period from Sept. 1 through Dec. 31 was the eighth-warmest since 1948.

Such a prolonged delay to the onset of winter makes one wonder if it will ever arrive this year. Though there is no clear way to be sure about the answer to that question, one potential phenomenon that can encourage a winter-like cold air outbreak is a sudden warming of the lower stratosphere, the layer of the atmosphere between 6 and 20 miles above the surface.

Every year, as the sun heads toward the horizon in polar regions at the autumnal equinox, a strong wind maximum develops on the edge of the cold, stratospheric air that is left in the expanding polar night. This jet is known as the polar night jet (PNJ). It is usually fairly east-west oriented with few undulations in it, and it provides dynamical support for containing cold air in the lower troposphere at high latitudes.

The PNJ can weaken rapidly when it is showered with wave energy that emanates from a parade of storms occurring in the underlying troposphere. Rapid weakening of the PNJ is often associated with lower stratospheric temperature increases of as much as 50 degrees in one day — sudden stratospheric warmings (SSWs).

With a weaker PNJ, the containment of cold polar air at lower altitudes is also weakened and so locations in the middle latitudes (where we live) are suddenly more susceptible to dramatic cold air outbreaks, often delayed by a few weeks from when the SSW occurs. At the turn of the new year, an SSW occurred and so some place in the Northern Hemisphere may be a couple of weeks away from a rude winter awakening.

Category: Meteorology, Phenomena, Seasons

Comments Off on Can weather in the stratosphere affect us near the ground?

What were the top weather events for 2018?

The Yahara River overflowed its banks on the east side of Madison in late August after the rainiest day ever recorded in the city. (Photo credit: Wisconsin Air Coordination Group and Wisconsin Drone Network)

The year began with frigid temperatures across Wisconsin. The average temperatures for the first seven days of January were well below normal across southern Wisconsin with most areas at least 15 degrees below normal.

The end of 2018 saw temperatures several degrees warmer than normal, including a record high temperature of 50 F on Dec. 27, tying a record high for the date, last set in 2003, and previously set in 1936 and 1946.

The year-to-date temperature across the globe was more than 1 degree above the 20th-century average of 57.2 F. That may turn out to be the fourth-highest global mean temperature in the 139-year record,

Southern Wisconsin experienced a rainy summer. The August precipitation that fell over the region was about 200 percent of normal. Total precipitation was also above normal for June and July. By the end of summer, we were about 6 inches above normal.

On Aug. 19, 2.74 inches fell on Madison, setting a daily record rain amount, beating the old record of 2.13 inches set in 2007. In particular, August has been exceptionally rainy compared to the prior five Augusts as the only above-normal August in that stretch occurred in 2014 (+1.14 inches).

The United States had a below-average number of tornadoes. There were no tornadoes in the U.S. rated above EF3, making 2018 the first year there were no violent tornadoes in the U.S.

There were 17 confirmed tornadoes in Wisconsin on Aug. 28 with the strongest rated as EF-2 on the enhanced Fujita scale. Damage to trees and agriculture was widespread on that day, but there were no reported fatalities or injuries.

Category: Climate, Meteorology, Seasons

Comments Off on What were the top weather events for 2018?

Will there be a White Christmas in Madison this year?

Climatological probability of a “White Christmas” across the contiguous United States.
(Data from NOAA)

In testimony to the infectious appeal of the famous scenes memorialized by Nathaniel Currier and James Ives, prolific lithographers of the middle 19th century, there is an enduring obsession with snow at Christmastime.

A so-called White Christmas is officially observed anytime there is 1 inch of snow on the ground on Christmas morning, whether or not it is snowing at the time.

On average, Madison experiences such a holiday only slightly more than 40 percent of the time. We have had memorably wintry Christmases in the relatively recent past, however. The morning low temperature on December 25, 2000, was a record -21 F with nearly 20 inches of snow on the ground, capping a remarkably snowy month of December that year.

On the other hand, on Christmas Day 1982 the temperature soared to a record high of 56 F with, of course, no snow except at the back door of ice rinks. The next year the minimum temperature on Dec. 25 was a balmy 45 F.

This year it is looking very unlikely that we will record a White Christmas. In fact, thus far in December, our climatologically snowiest month of the year, we have received 1 inch — well behind pace.

Meanwhile, places such as North Carolina and St. Louis have already received their first major storms of the year.

For those of us who are feeling the snow drought more acutely than others, there is some cause for hope. Medium range forecast models are currently suggesting the last week of December may be our first snowy week with a chance of light snow on more than a few of those days.

Steve Ackerman and Jonathan Martin, professors in the UW-Madison Department of Atmospheric and Oceanic Sciences, are guests on WHA radio (970 AM) at 11:45 a.m. the last Monday of each month.


Category: Climate, Meteorology, Seasons

Comments Off on Will there be a White Christmas in Madison this year?

How are clouds named?

This uncommonly clear view of an entire thunderstorm cell, with the top of the growing cumulonimbus tower topping out at 40,000 feet, reveals many interesting features, including “fall streaks” of what may be hail from the underside of the overhanging anvil portion of the cloud. Shortly after this photo was taken on May 22, 2011, near Madison, the storm pelted the Sun Prairie area with large, damaging hail. (Photo credit: Grant Petty, faculty, Department of Atmospheric and Oceanic Sciences, Winner: 2012 Cool Science Image contest)

In 1803, British pharmacist and chemist Luke Howard devised a classification system for clouds. It has proved so successful that meteorologists have used Howard’s system ever since, with minor modifications.

According to his system, clouds are given Latin names corresponding to their appearance — layered or convective— and their altitude. Clouds are also categorized based on whether they are precipitating.

Layered clouds are much wider than they are tall. They generally have flat bases and tops and can extend from horizon to horizon. The Latin word stratus describes the layered cloud category.

Convective clouds are as tall, or taller, than they are wide. These clouds look lumpy and piled up, like a cauliflower. Convective cloud types are indicated by the root word cumulo, which means “heap” in Latin. Convective clouds may become very tall and are rounded on top.

Their altitude and their ability to create precipitation also classify clouds. The root word cirro (meaning “curl”) describes a high cloud that is usually composed of ice crystals which accounts for their wispy appearance. The Latin word alto (“high”) indicates a cloud in the middle of the troposphere that is below the high cirro-type clouds. The prefix or suffix nimbus (“rain”) denotes a cloud that is causing precipitation.

Using the combination of appearance, altitude and ability to make precipitation, a wide range of cloud types can be identified. The 10 basic cloud types are cirrus, cirrostratus, cirrocumulus, altostratus, altocumulus, cumulus, stratus, stratocumulus, nimbostratus and cumulonimbus.

Category: Meteorology, Phenomena

Comments Off on How are clouds named?