The technology that allows us to know the temperature, humidity and chance of precipitation on an hourly basis is something on which we’ve come to expect and rely. But ever wonder how the technology of predicting the weather came about?
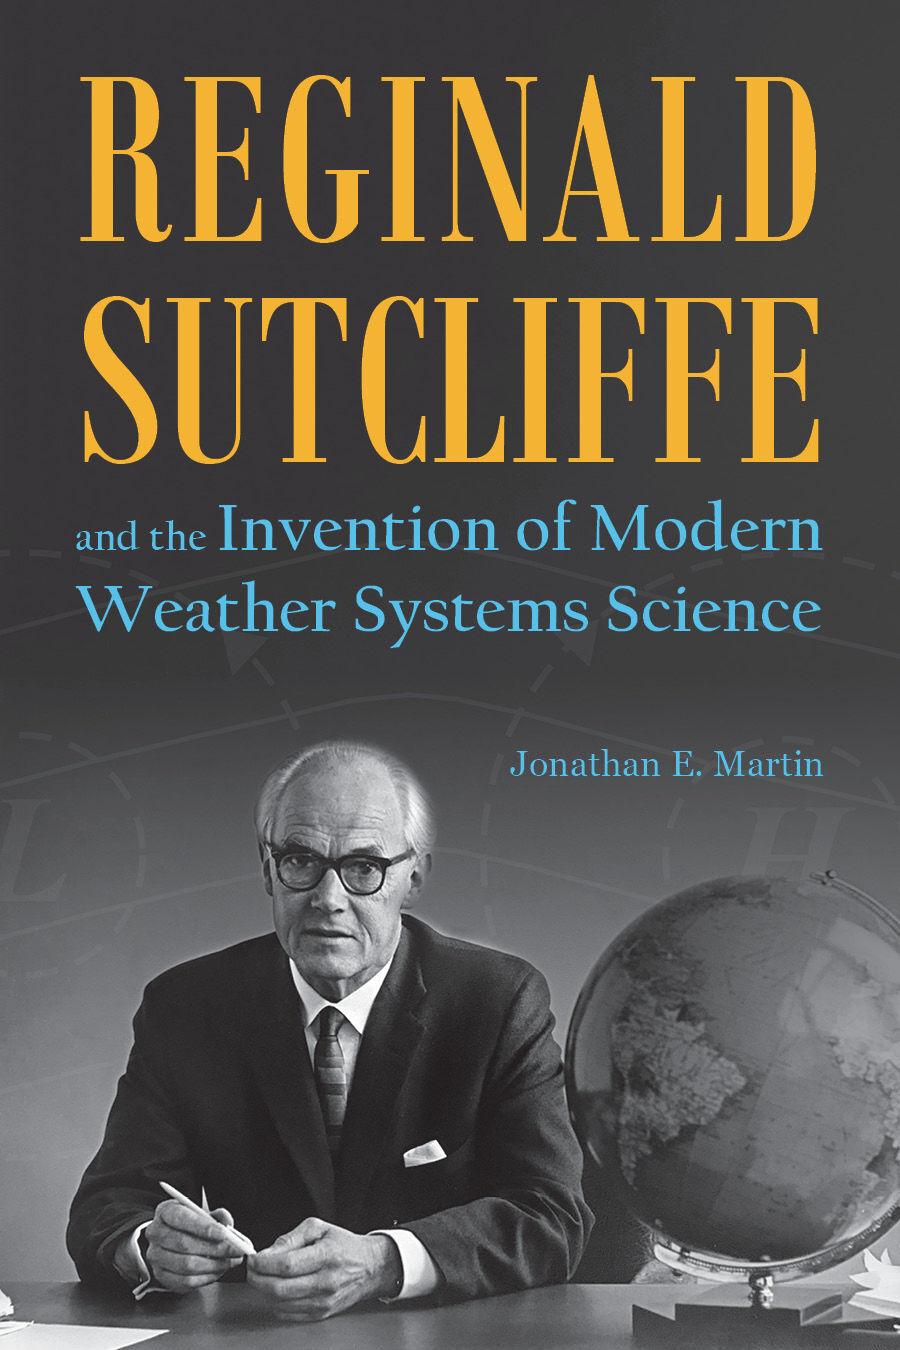
UW-Madison professor Jonathan Martin, one of the writers of the State Journal’s “Ask the Weather Guys” column, answers that question in his new book “Reginald Sutcliffe and the Invention of Modern Weather Systems Science,” which came out March 15. He’ll be discussing the book during a virtual event through Mystery to Me bookstore later this month.
Q: Your biography is on Reginald Sutcliffe, who you credit as the father of our modern day weather predicting science, but start by telling me a little about yourself.
A: I’ve been at the University of Wisconsin-Madison since the fall of 1994, 27 years, in the same department, teaching about and researching aspects of the mid-latitude cyclone and how it connects to the climate system. Every fall I teach a class in mid-latitude weather systems where Sutcliffe made his major contributions. In the spring I most often teach an intro to weather and climate class
Q: Who was Reginald Sutcliffe?
A: I think it is fair to say that he is one of the giants in developing our modern understanding … of how weather systems really work. Until he came along knowledge was based entirely on observations of weather systems — known events of the past. Now it’s much more physically based. Sutcliffe was a giant in pulling that information out of the ether. The foundation of knowledge that he laid was essential in that revolution. In a way, he’s like a science Moses. He brought us to the promised land and never got there himself.
Q: What led Sutcliffe, who is British and lived from 1904 to 1991, to this revolution?
A: He was a Ph. D. mathematician who graduated in 1927. At the time, nearly all positions available for Ph.D mathematicians were jobs as teachers and he didn’t want to do that. He heard from the guidance office at the University of Leeds that the Meteorological Office tended to hire mathematician grads so he took a job with the Meteorological Office. … Through a series of very lucky coincidences he ended up being pushed in a direction where his initial frustration that meteorology was quite non-scientific was remedied by doing research work. … He was commissioned to write a textbook on meteorology for pilot training in 1938. This forced him to read extensively in meteorology and that reading led to an explosion of creativity.
Q: You mentioned he was not a strong believer in computers and their role in weather prediction, why not?
A: I think the reason he was never enthusiastic about numerical weather prediction was that in the initial 15 years of the development of using computers for forecasting, the computer generated forecasts were inferior to those made by experienced professional forecasters like Sutcliffe. It takes expert judgment to make sense of the vast amount of information available to make a reasonable statement of how the weather will evolve.
Q: How did you come to write this book?
A: A graduate professor of mine was a fan of Sutcliffe and thought he had some big insights. I hadn’t heard much about him as an undergrad. It wasn’t until I got the job in Wisconsin, 27 years ago this month, with my first task to prepare a class on mid-latitude cyclones for the fall of 1994, that I recognized him as such an important figure. As I put those notes together it occurred to me that Sutcliffe had his fingerprints on every single major insight that we have about such weather systems. I was touched by his genius.
Q: How does this biography compare to other books you’ve written?
A: I wrote one text book for the intro class and a much more substantial one for my senior level/graduate student course. For me, when you’re an academic, such textbooks can be seen as a logical extension of the professional obligation we all have at Wisconsin to teach and publish new discoveries about nature … we’re all obviously heavy into research. It’s nice to leave a legacy about how you understand things when you write a textbook. But to write a biography … that was a little out of the mainstream. It’s a different, and very exciting feel. I don’t take for granted how lucky I have been to undertake it and, to complete it, really made me proud.
Q: Do you want to do it again?
A: I think if the right subject came about and it was a feasible project. There is something really energizing about breathing life into something that may have been forgotten. Everybody looks at their phone to look at the weather. Some people are interested in why we’re able to do that — from where does that amazing capability arise. It’s because we’ve developed some really rigorous understandings about how the atmosphere works. We’re the first generation of humans to live in the presence of that miracle. I think I’m not the only one who thinks that is an interesting story.
Check it out
What: A virtual visit with author Jonathan E. Martin, whose book “Reginald Sutcliffe and the Invention of Modern Weather Systems Science,” came out earlier this month.
When: March 24 at 7 p.m.
For more information, visit: www.crowdcast.io/e/sutcliffe/register