How good are the groundhog predictions?

The predictions made by this folk forecast are correct only about 40 percent of the time — vastly inferior to what is delivered by modern science. If you flip a coin, you’ll be right close to 50 percent of the time.

This year’s prediction by the furry animal is for an early spring. As for a more scientific approach, temperatures over the next six weeks look about average.

The forecast made on Groundhog Day is an example of predicting the weather based on folklore. If the groundhog comes out of its hole and sees its shadow, we are in store for 40 more days of winter.

Long before computers, the Weather Channel and the internet, humans needed weather forecasts. Farmers and sailors particularly needed to know if storms were approaching. Over time, various folklore forecasts, often in the form of short rhymes, were devised and passed down through the generations.

Although memorable, the folklore forecasts are of uneven quality — some good, others bad.

The roots of Groundhog Day go back to the 6th century. Feb. 2 is 40 days after Christmas and is known as Candlemas. On this day, candles that are used for the rest of the year are blessed. This is also about the midpoint in winter, in meteorological not astronomical terms. The forecast rhyme goes:

If Candlemas Day is bright and clear
There’ll be two winters in that year;
But if Candlemas Day is mild or brings rain,
Winter is gone and will not come again.

If the day is bright and clear, the groundhog “sees” his shadow and we have more winter. Of course, after Feb. 2, there are only 47 days left of astronomical winter — which ends on or about March 21, so the forecast accuracy should be more than luck.

Of course, the weather conditions on Feb. 2 at single locations like Sun Prairie or Punxsutawney, Pennsylvania, tell us very little about the weather for the rest of the winter season. Right or wrong, they are fun community celebrations.

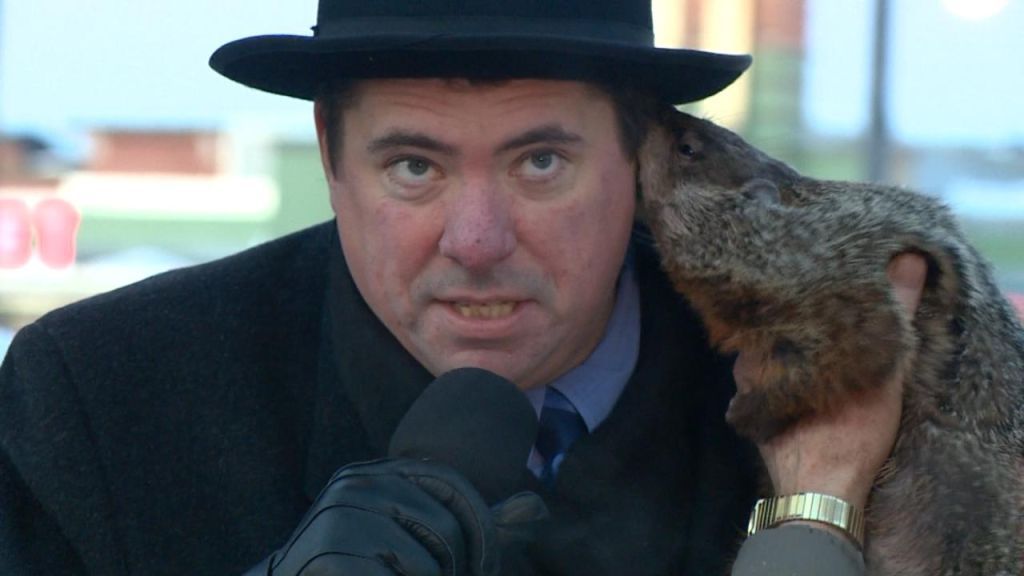
Jimmy the Groundhog famously bites the ear of then-Sun Prairie Mayor Jon Freund in 2015!

Category: Meteorology, Seasons

Comments Off on How good are the groundhog predictions?

How low will temperature go?

Arctic air mass plunging into the Great Lakes Region. (Image credit: ClimateReanalyzer.org)

On Jan. 30, 1951, the morning low temperature in Madison fell to minus 37. Nearly 12 years later, on Jan. 15, 1963, the mercury dropped to precisely minus 30.

These two days remain the only dates in Madison’s recorded history with temperatures as cold as minus 30. On those record-setting days a number of characteristic meteorological conditions were in play to drive the temperature to such extremes.

A healthy blanket of fresh snow on the ground is one such condition. Snow has two properties that contribute to cooling. First, it insulates the ground, effectively keeping the vast reservoir of infrared (thermal) energy in the ground.

Second, snow is very good at emitting infra-red energy, so the top surface of the snow can cool rapidly over the course of a long winter night while energy from the underlying surface is kept from reaching the top of the snow. If the wind is light, the frigid air cooling on top of the snow tends to pool in low-lying areas, such as Truax Field at Dane County Regional Airport.

Finally, when the air in the lowest levels of the atmosphere is also very cold that ensures the air is very dry (has little water vapor in it). This lack of water vapor further enhances the cooling that can be accomplished by emission of infrared radiation.

With the exception of really light winds, all of these variables will be at historic levels early Wednesday morning. That leads us to think that we will make a run at the all-time lowest temperature in Madison that morning.

With slightly stronger winds likely to characterize that morning compared to the prior minus 30 mornings in our past, even if the temperature does not approach the record, the combination of cold and wind will bring wind chills down near or past minus 60 — extremely dangerous conditions.

Be very careful venturing outside during this coming week – we will be talking about its cold for years to come.

Category: Meteorology, Seasons, Severe Weather

Comments Off on How low will temperature go?

Is winter finally here?

January 21 Terra MODIS view of wintry Wisconsin (Photo credit: CIMSS)

Though we have enjoyed a remarkably warm December and first half of January in Madison this year, we are now entering deep winter.

The period from Dec. 1 through Jan. 17 has averaged 7.4 degrees above normal this year and has contributed to our breaking  or approaching several obscure, but nonetheless, interesting records of prolonged warmth — provided courtesy of Jordan Gerth at the Space Science and Engineering Center at UW-Madison.

We have already broken the previous record for latest date with a low temperature of 10 degrees or colder, set on Jan. 11, 1914.  This year, we made it to Saturday, when the overnight low was zero.

A related measure, the record for the number of consecutive days with a low temperature of 10 degrees or warmer, had already been broken this year.  The prior record was 324 consecutive such days (Feb. 10, 1997, to Dec. 30, 1997).  The streak that began Feb. 14, 2018, ended Saturday, meaning we set a new record of 339 days.

As of Monday, we will likely edge up to the fifth spot in the latest first day (after July 1) for a low temperature below zero.  The all-time latest occurred on March 3, 2002 — nearly a full month later than its nearest competitor.

Similarly, the number of consecutive days with a low temperature warmer than zero ended Sunday at 341 days.  The all-time record in this category is 378, set between Feb. 18, 2001, and March 2, 2002.

So, even as you are cursing the cold in the last week of January, remember it has been a remarkably long run of unseasonably warm weather.

Category: Meteorology, Seasons, Severe Weather

Comments Off on Is winter finally here?

What is the status of Antarctica’s ice sheets?

The Antarctic Meteorological Research Center (AMRC) at the UW-Madison’s Space Science and Engineering Center (SSEC) maintains 57 Automated Weather Stations (AWS) in Antarctica. In the photo, Elina Valkonen and David Mikolajczyk travel by Twin Otter aircraft to service a remote weather station.
(Photo credit: AMRC)

Most of Antarctica is covered by ice.

The ice sheet is over 2 miles thick in places and in some places the ice sheet bottom is almost a mile below sea level. This massive ice covers mountain ranges, and volcanoes exist underneath the sheets.

The Antarctic Ice Sheet is categorized as three ice sheets: the Antarctic Peninsula Ice Sheet, the West Antarctic Ice Sheet and the East Antarctic Ice Sheet.

The Antarctic Ice Sheet currently discharges 90 percent of ice and sediment through corridors of fast-flowing ice within an ice sheet known as ice streams. Ice streams are typically large features, greater than 25 miles in width, and longer than 90 miles. Today, ice streams drain the Antarctic continent, with tributary glaciers reaching hundreds of miles inland.

Overall, recent estimates indicate that over a 19-year survey, Antarctic’s net ice mass is decreasing. Satellite observations measured a widespread enhanced flow toward the ocean, with tributary glaciers reaching deep into Antarctica’s interior.

Antarctica drains more than 80 percent of its ice sheet through floating ice shelves. In recent years we have seen the collapse and melting of these ice shelves. In 2002, satellite imagery captured the collapse of the entire 1,250-square-mile Larsen B Ice Shelf. The disintegration of this Antarctic Peninsula ice sheet was rapid.

New observations indicate that glaciers in East Antarctic have begun to melt. Scientists have long considered these glaciers to be more stable than those in West Antarctica. Glaciers around the West Antarctic Ice Sheet are currently thinning. The Antarctic Peninsula Ice Sheet is changing most rapidly.

Category: Climate, Meteorology, Seasons

Comments Off on What is the status of Antarctica’s ice sheets?

Can weather in the stratosphere affect us near the ground?

Thus far the winter has been relatively mild around the Northern Hemisphere. This December was the 14th-warmest December, and the period from Sept. 1 through Dec. 31 was the eighth-warmest since 1948.

Such a prolonged delay to the onset of winter makes one wonder if it will ever arrive this year. Though there is no clear way to be sure about the answer to that question, one potential phenomenon that can encourage a winter-like cold air outbreak is a sudden warming of the lower stratosphere, the layer of the atmosphere between 6 and 20 miles above the surface.

Every year, as the sun heads toward the horizon in polar regions at the autumnal equinox, a strong wind maximum develops on the edge of the cold, stratospheric air that is left in the expanding polar night. This jet is known as the polar night jet (PNJ). It is usually fairly east-west oriented with few undulations in it, and it provides dynamical support for containing cold air in the lower troposphere at high latitudes.

The PNJ can weaken rapidly when it is showered with wave energy that emanates from a parade of storms occurring in the underlying troposphere. Rapid weakening of the PNJ is often associated with lower stratospheric temperature increases of as much as 50 degrees in one day — sudden stratospheric warmings (SSWs).

With a weaker PNJ, the containment of cold polar air at lower altitudes is also weakened and so locations in the middle latitudes (where we live) are suddenly more susceptible to dramatic cold air outbreaks, often delayed by a few weeks from when the SSW occurs. At the turn of the new year, an SSW occurred and so some place in the Northern Hemisphere may be a couple of weeks away from a rude winter awakening.

Category: Meteorology, Phenomena, Seasons

Comments Off on Can weather in the stratosphere affect us near the ground?