How does this current February warm spell rank?

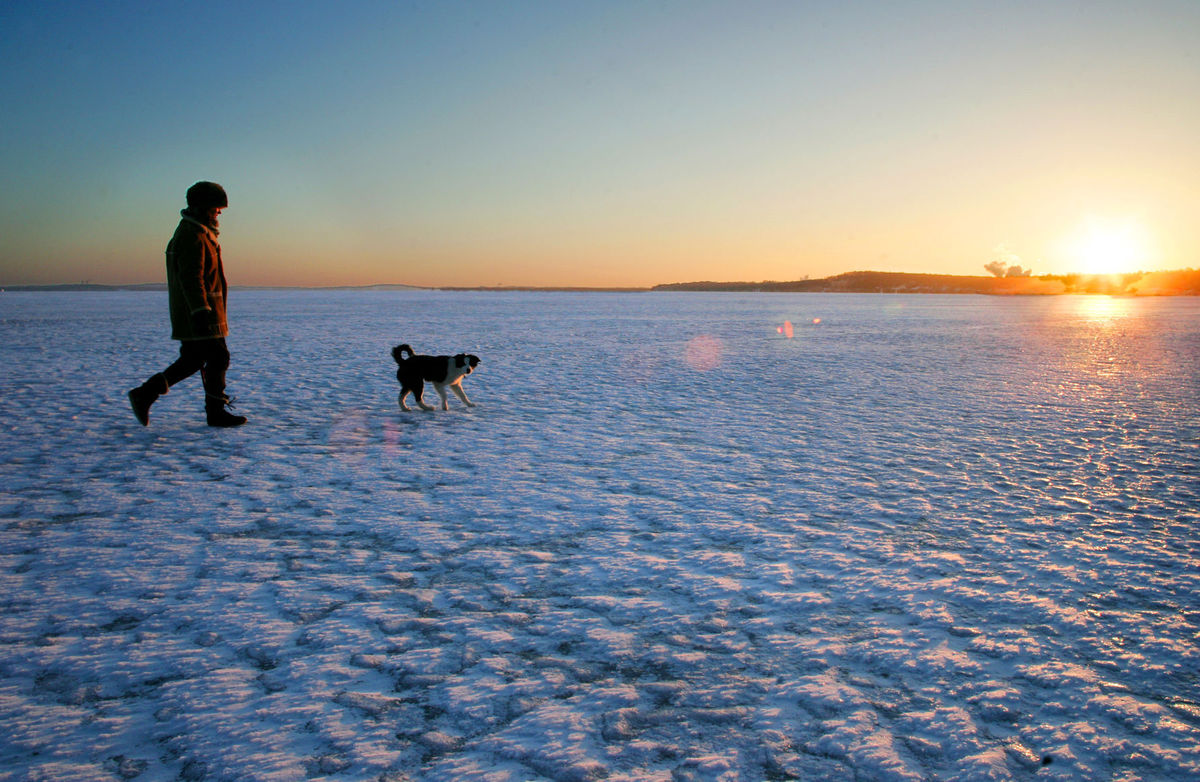
A frozen lake is a public good for all.
Photo Credit: John Hart, WSJ

It’s no secret we have had some amazingly warm weather the past few days. After reaching 60 Fahrenheit Friday February 17, the temperature soared to 62 F Saturday in Madison, breaking the previous record for the date (57 F) set in 1981.

In Milwaukee, the record-shattering was even more extraordinary as the Saturday high of 67 F broke the old record for the date – set in 1877—by 10 degrees! In fact, Milwaukee’s high of 67 F was just one degree short of its all-time February record of 68 set on Feb. 11, 1999.

Madison’s 62 F on February 18 was only two degrees shy of its all-time monthly record of 64 F set on February 25, 2000.

These are clearly exceptional temperatures!

Combining Friday and Saturday’s warmth with what appears likely in the short-term forecast, both cities may be in the running to record another unusual meteorological event by Wednesday of this week.

It is quite rare for six consecutive days in February to have high temperatures of at least 50 F. This last occurred in Milwaukee in 2000 while the wait has been much longer in Madison – not since 1930!

The expansive ridge of high pressure that is responsible for our warm spell appears reluctant to move so we may well see the longest February warm streak in Madison since Herbert Hoover was living in the White House.

In addition, it is not inconceivable we could set a daily record on every one of those days. It is a welcome respite from winter and should serve as an encouraging reminder of what is to come.

Steve Ackerman and Jonathan Martin, professors in the UW-Madison department of atmospheric and oceanic sciences, are guests on WHA radio (970 AM) at 11:45 a.m. the last Monday of each month.

Category: Uncategorized

Comments Off on How does this current February warm spell rank?

How is the ice cover on the Great Lakes?

National Oceanic and Atmospheric Administration (NOAA) monitors and reports on the ice coverage of the Great Lakes.

The average concentration of ice on Lake Superior is currently 5.7 percent, compared to 4.6 percent last year and 55.5 percent in 2015.

Lake Michigan’s ice coverage is currently at 14.4 percent, compared to 11.9 percent in 2016 and 33.8 percent in 2015. Lake Huron’s coverage is 24.8 percent this year, compared to 13.7 percent and 75.8 percent in 2016 and 2015, respectively.

Lake Erie, the shallowest lake is currently at 14.3 percent ice coverage, compared to only 3 percent in 2016 and 95.2 percent in 2015. And finally, Lake Ontario ice coverage is 2.3 percent, compared to 0.4 percent in 2016 and 33.4 percent in 2015.

The density of liquid water depends on the water temperature. The density of water is highest at a temperature of about 40 degrees.

 During winter, lakes lose energy to the atmosphere as the water near the surface cools.

The density of the water near the surface increases and this surface water sinks because it is denser than the warmer water below.

Warmer water under the surface rises to replace this sinking water because of its smaller density. When all the lake water reaches a temperature of 40 degrees, further cooling of the surface water makes it colder than 40 degrees and, because it is now less dense than the water around it, it will float and continue to cool.

Once this surface water decreases to 32 degrees, the water freezes. The freezing then spreads downward into the lake and the ice thickens.

Freezing also first occurs along the shoreline, where the water is shallow. Before ice can form on the surface, the entire water column must first reach a temperature of 40 degrees, and this is likely to first occur along the shoreline.

Steve Ackerman and Jonathan Martin, professors in the UW-Madison department of atmospheric and oceanic sciences, are guests on WHA radio (970 AM) at 11:45 a.m. the last Monday of each month.

Category: Climate, Meteorology, Phenomena, Seasons

Comments Off on How is the ice cover on the Great Lakes?

How good are the groundhog predictions?

Jimmy the Groundhog bites the ear of Sun Prairie Mayor Jon Freund on Groundhog Day 2015!


For well over 100 years, the emergence of the groundhog in early February has stirred the imaginations of shivering, winter-stressed humans across the United States.

Of course, no reasonable person harbors the expectation a rodent could best a human in any contest of meteorological skill.

The forecast made on Groundhog Day is an example of predicting the weather based on folklore. If the groundhog comes out of its hole and sees its shadow, we are in store for 40 more days of winter. Of course, after Feb. 2, there are only 47 days left of astronomical winter – which ends on or about March 21.

The predictions are correct about 40 percent of the time – vastly inferior to what is delivered by modern science.

Long before computers, the Weather Channel and the internet, humans needed weather forecasts. Farmers and sailors particularly needed to know if storms were approaching.

Over time, various folklore forecasts, often in the form of short rhymes, were devised and passed down through the generations. Though memorable, the folklore forecasts are of uneven quality — some good, others bad.

The roots of Groundhog Day go back to the sixth century. Feb. 2 is 40 days after Christmas and is known as Candlemas. On this day, candles that are used for the rest of the year are blessed. This is also about the midpoint in winter in meteorological, not astronomical, terms.

The forecast rhyme goes:

If Candlemas Day is bright and clear
There’ll be two winters in that year;
But if Candlemas Day is mild or brings rain,
Winter is gone and will not come again.

Of course, the weather conditions on Feb. 2 at single locations like Punxsutawney, Pennsylvania, or Sun Prairie tells us very little about the weather for the rest of the winter season. Right or wrong, they are fun community celebrations.

Steve Ackerman and Jonathan Martin, professors in the UW-Madison department of atmospheric and oceanic sciences, are guests on WHA radio (970 AM) at 11:45 a.m. the last Monday of each month.

Category: Meteorology

Comments Off on How good are the groundhog predictions?

What was Madison’s coldest day?

Nika Porter, of Madison, contends with some of the coldest temperatures of the year on Jan. 7, 2015, but they didn’t come close to the city’s record low of minus 37 degrees on the morning of Jan. 30, 1951. (Photo credit: John Hart, State Journal)

Today is the 66th anniversary of the coldest day in Madison’s history.

On Jan. 30, 1951, the temperature in the city reached a morning low of minus 37 degrees. That is far below any temperature we have experienced in the city in the last 25 or more years.

A perfect combination of meteorological events have to conspire to get the temperature that low in southern Wisconsin.

One necessary ingredient is a relatively fresh snow cover, which does two jobs simultaneously.

First, the snow insulates the surface, thus preventing the vast amount of energy that is contained in the ground from radiating upward and helping to warm the air.

Second, snow is an excellent emitter of infrared energy and so, over the course of a long winter night, it is able to emit a huge amount of energy upward, thus cooling the air just above the snow surface to very low temperatures. This radiative cooling is greatly enhanced if the sky is perfectly clear and the air very dry.

To get as low as it did on Tuesday, Jan. 30, 1951, the air had to be even colder at its origin in central or northern Canada.

That means that the same conditions of snow cover and clear skies would have had to exist, unbroken, along a very great distance from Canada into Madison.

In that way, as the cold air headed southward toward us, it was not modified (warmed) very much.

Though it is not a guarantee, of course, it seems unlikely that this all-time record will be broken in the near future.

Category: Meteorology, Seasons, Severe Weather

Comments Off on What was Madison’s coldest day?

Why does the morning low temperature sometimes occur after sunrise?

On certain mornings, in all seasons, the lowest temperature is often recorded just after sunrise. (Photo credit: State Journal Archives)

Those who keep a particularly vigilant eye on the weather might have noticed that on certain mornings, in all seasons, the lowest temperature is often recorded just after sunrise.

One of us had a morning paper route as a boy and was puzzled for years about this seemingly counterintuitive phenomena. How could the temperature continue to fall for the few minutes after sunrise on a cold winter morning?

The answer lies in the fact that the Earth and the sun radiate different kinds of energy and one needs to consider the budget of this energy to make sense of this recurring observation.

On a clear, calm winter night the Earth’s surface radiates infra-red energy upward towards space. With the sun already down, there is no shortwave solar radiation (and only a very little infra-red energy from the overlying atmosphere) directed downward toward the surface. Consequently, with each passing second, the surface emits more energy than it receives and the surface temperature drops.

This continues all through the night with the accumulated loss of infra-red energy from the surface accounting for the continued decrease in the surface temperature. When the sun finally rises above the horizon and spreads the first faint rays of solar energy across the surface, there is finally some incoming radiation. However, for several minutes the meager amount of incoming radiation is not sufficiently large to counter the amount of infra-red energy still being emitted from the surface. As a result, the surface temperature continues to drop even in the face of the newly risen sun. Science wins again.

Category: Meteorology, Phenomena

Comments Off on Why does the morning low temperature sometimes occur after sunrise?