Does weather impact beer making?

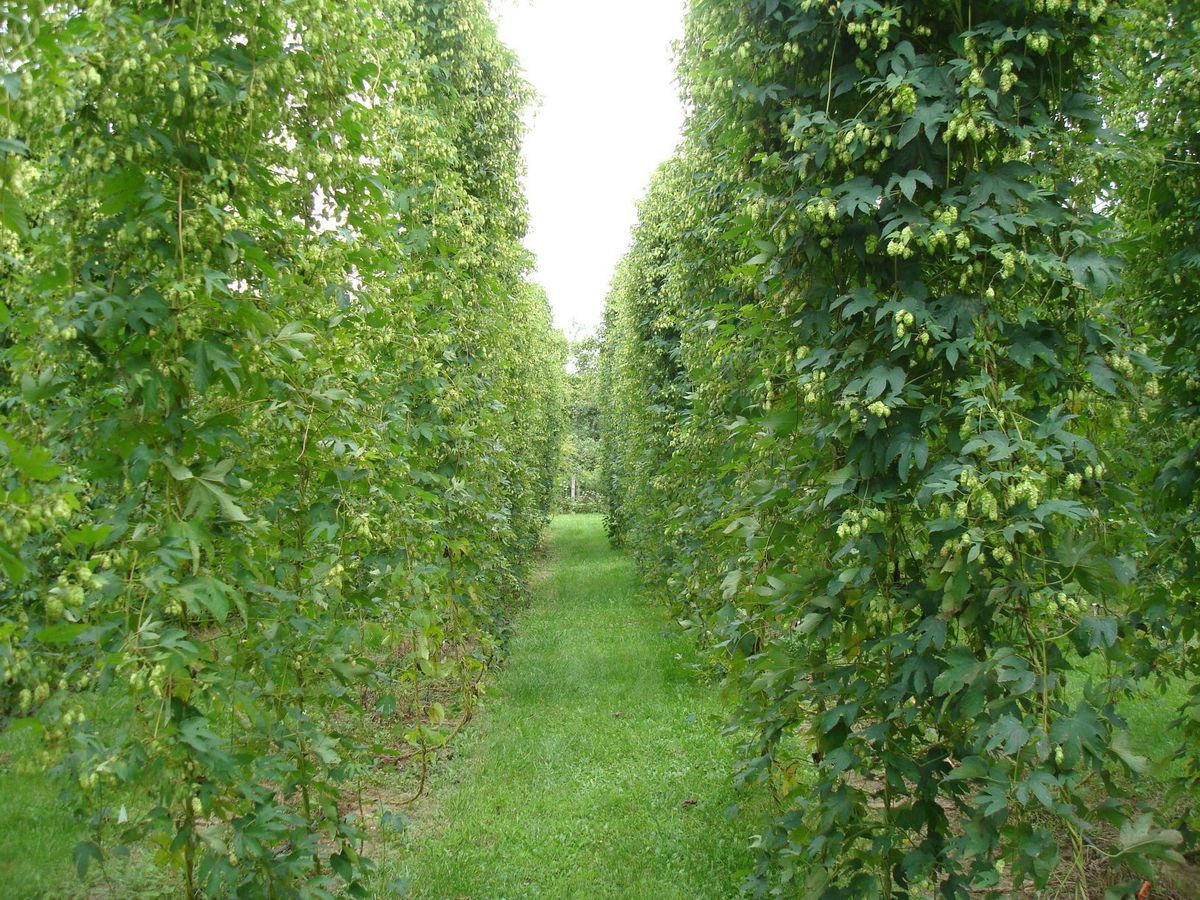
Silver Hops farm near Sun Prairie Wisconsin. 
(Photo credit: Alyssa Stang)

Weather impacts all crops, as all plants prefer certain climatic regimes.

Fermented grain is an important ingredient in beer brewing. It defines the alcohol content.

Hops are just as critical, as the flower buds of hop plants add unique flavors, aroma and bitterness to the beer.

Hops grow very fast and require a lot of water. As the Pacific Northwest of the U.S. gets a lot of precipitation, this is a major hop-growing region as irrigation needs are limited. Washington State produces almost three-quarters of the hops used in US beers, with Oregon and Idaho contributing the second most hops. A drought in those regions will significantly reduce yields of hops and impact the beer brewing economy, leading to higher prices and a change in taste of some brands.

In 2015 the hops growing region of the Northwest had an unusually warm winter that led to widespread drought. As a result of the warm winter, the Cascades got mostly rain and a substantially reduced snowpack resulted. By May, an important time for the hops to be watered, the area was starved for water as there was no snow to melt.

Hops are grown on a type of hemp plant and grow best in USDA hardiness zones 5 through 9, which includes Wisconsin. The Wisconsin Hop Exchange Cooperative is one group that is working to establish the state as a producer of high-quality hops.

If you are a beer drinker who likes hoppy IPAs, you might hope for the exchange to prosper and for the Northwest to avoid developing a drier climate.

Steve Ackerman and Jonathan Martin, professors in the UW-Madison department of atmospheric and oceanic sciences, are guests on WHA radio (970 AM) at 11:45 a.m. the last Monday of each month.
Category: Uncategorized

Comments Off on Does weather impact beer making?

How much water is in the atmosphere?

Sitting nearly in the middle of the vast North American continent, Madison has what is known as a continental climate. Continental climates are characterized by large annual extremes in temperature and humidity as well as very distinct seasons.

The continental nature of Madison’s climate is what makes a year’s worth of weather in Madison usually a lot more varied than a year’s worth in Seattle, for instance. There is an astounding 144 degrees difference between the all-time highest (107 on July 13, 1936) and all-time lowest (-37 on Jan. 30, 1951) temperature in Madison.

In addition, the amount of water vapor in the air can range from the barely detectable level in the midst of a deep winter cold spell to as much as 3.5 percent of every breath you take during a severe July heatwave. No matter what the season, the vast majority of the invisible water vapor in the atmosphere is contained in the lowest mile or two from its source at the surface.

At any one instant, the Earth’s atmosphere contains 3.75 million-billion gallons of water vapor – enough to cover the entire surface of the planet with 1 inch of rain if condensed. This amount is recycled, through evaporation powered by the Sun, 40 times each year in what is known as the hydrologic cycle.

In each of these 40 cycles, enough energy is expended to power the U.S. — the largest consumer of energy in the world — for 3,441 years! A truly astounding amount of energy.

Category: Climate, Meteorology, Seasons

Comments Off on How much water is in the atmosphere?

Is winter winding down?

Ice accumulations formed by winds and sub-freezing temperatures hold to tree branches along the Lakeshore Path on the campus of UW-Madison in November. After mid-Feburary, it is rather unlikely we will experience another cold air event. (Photo credit:: John Hart, State Journal Archives)

Despite a prolonged deep freeze that straddled the end of December and the first week of January, during which we had below-zero morning low temperatures on 12 of 13 consecutive days, the month of January is likely to end at just about normal for Madison.

We are not, however, out of the woods just yet. Climatologically, the last week of January/first week of February is the coldest time of the year as a result of several physical factors.

First, the number of daylight hours at high latitudes in the Northern Hemisphere is very small – reaching its annual minimum on Dec. 21. For nearly a month, the increase in sunlight is very meager.

This means that very little input of solar energy is available in high latitude locations and nearly continual nighttime cooling prevails. Consequently, the generation of cold air masses is at its peak during this first four to six weeks of winter.

In line with these factors, Madison’s all-time lowest temperature, minus-37, was recorded on Jan. 30, 1951.

After the first week of February, however, the daily increase in daylight accelerates everywhere – this is even noticeable in Madison as the time of sunset is appreciably later by then.

As a result, it becomes more difficult to manufacture truly frigid air at high latitudes and this, in turn, greatly reduces our chances of an additional prolonged blast of arctic air.

So, even though the medium-range forecast suggests we will have another cold air event in the coming 10 days, take solace in the fact that it is rather unlikely that an additional such event will follow after mid-February. The cosmological and climatological decks are stacked against it.

Category: Meteorology, Seasons

Comments Off on Is winter winding down?

What was 2017 weather summary?

People move through flooded streets in Havana after the passage of Hurricane Irma in September. The 2017 season had the highest number of major hurricanes since 2005. (Photo credit: Ramon Espinosa, Associated Press)

The National Oceanic and Atmospheric Administration has completed its scientific analysis and the globally averaged surface temperature for 2017 was the third-highest since record keeping began in 1880.

The warmest year is 2016, and 2015 is the second warmest. Since 1977 global temperatures have been at least nominally above the 20th century average. The six warmest years on record have occurred since 2010.

Everyone has his or her own personal stories of top 2017 weather events. Chances are many will remember the cold weather at the end of December.

Temperatures were mostly above normal in the first two-thirds of December, particularly the week before Christmas. Then Arctic air pushed south across the region and extended all the way to the Gulf of Mexico in the last week of the year, bringing cold temperatures to southern Wisconsin. The cold outbreak was enough to make average December temperature in southern Wisconsin below normal by 2 to 3 degrees. A lake-effect snowfall dumped 66 inches in Erie, Pennsylvania, at the end of December.

At the end of the year, southern Wisconsin was 20 inches below normal in total snowfall. Yet the average annual Northern Hemisphere snow cover extent during 2017 was above the 1981-2010 average, the largest since 1985 and the eighth-largest in the 1968-2017 record.

Recent trends in the decline of Arctic sea ice extent continued in 2017. The average annual sea ice extent in the Arctic was approximately 4.01 million square miles, the second-smallest annual average in the 1979-2017 record.

The 2017 hurricane season was one of only six seasons on record to feature multiple Category 5 hurricanes. This was the second season on record (after 2007) to feature two hurricanes making landfall at Category 5, Irma’s landfalls on multiple Caribbean islands and Maria’s landfall on Dominica. This season had the highest number of major hurricanes since 2005.

On a warmer note, the summer average temperature for Wisconsin was about average, with summer precipitation above average.

Category: Climate, Meteorology

Comments Off on What was 2017 weather summary?

Is there snow and ice on other planets?

Becky Williams, science researcher with the Mars rover Curiosity project, examines imagery captured on the surface of the planet on a computer screen in the work office of her Waunakee home. The researcher was the lead author of an article in the journal Science regarding the team’s discovery of water evidence on the planet in 2013. (Photo credit: John Hart, State Journal Archives)

Like Earth, the north and south poles of Mars have ice caps that grow and shrink with Mars’ seasons.

Mars’ ice caps are made mainly of water ice, although Mars is cold enough to also have frozen carbon dioxide, or dry ice.

Carbon dioxide is in the Martian atmosphere and it freezes and falls to the surface of the planet as dry ice snow.

The Mars Reconnaissance Orbiter, or MRO, has observed pools of seemingly pure ice at the bottom of small meteorite craters. Radar observations of Mars have indicated that deposits of ice are buried below the surface.

Recently, the MRO has detected layers of ice in exposed cliffs poleward of 55 degrees north and south.

The banding structure in the cliffs suggests the deposits built up over many seasons and may provide clues to Mars’ past climate.

The Lunar Reconnaissance Orbiter has detected water ice in shadowy craters near the north and south poles of Earth’s moon. Enceladus, one of Saturn’s moons, has an icy surface and is the brightest moon in our solar system.

Below its icy surface is a heated ocean. Geysers shoot water from below out into space. The water freezes and falls back to the surface as snow.

Saturn’s smallest moon, Mimas, is a ball of almost pure water ice about 123 miles across.

Neptune’s largest moon, Triton, has geysers like Enceladus. These geysers are made up of nitrogen rather than water. This nitrogen freezes, covering Triton with ice made of frozen nitrogen.

Io, one of the many moons orbiting Jupiter, has “snowflakes” made out of sulfur.

Category: Meteorology, Uncategorized

Comments Off on Is there snow and ice on other planets?