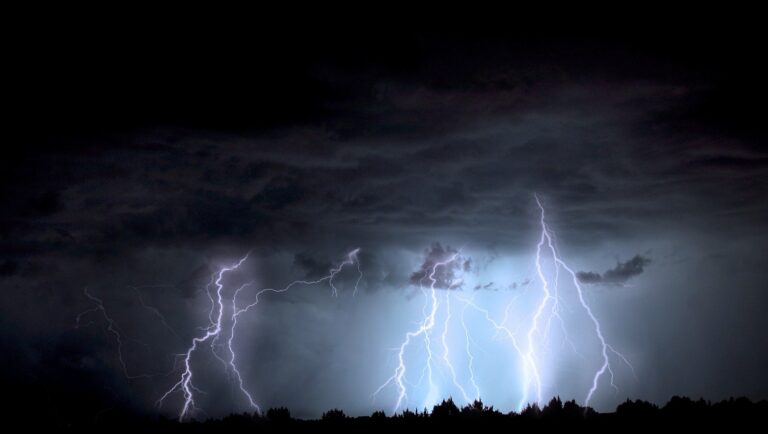
A haboob is dust storm that can be several miles long, several thousand feet high, and can travel hundreds of miles. Haboobs are caused when an intense column of sinking air in a thunderstorm hits the ground and lofts soil particles into the air. These downdrafts, referred to as a microburst, can hit the ground at 50-80 mph and then spread in all directions. The resulting winds stir up dust and dirt from large arid areas which then get blown along in front of the approaching thunderstorm. The lofted particles can reach heights of 5000 ft and can extend up to 100 miles wide.
The name “haboob” is derived from the Arabian word ‘hab’, meaning ‘to blow,’ and was originally the name for a dust storm or sandstorm in the northern part of Sudan.
These storms can strike suddenly, making driving conditions hazardous. The dust quickly reduces visibility and has caused massive pileups. The strong winds can stir up infectious spores and make them easier to inhale, increasing the risk of respiratory infection.
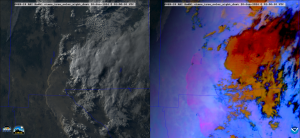
Phoenix, Arizona residents have experienced these storms and were recently engulfed by one on August 25, 2025. Haboobs are associated with convective downdrafts within a storm but also by the condition of the surface – how much vegetation is on the surface and is the surface wet or dry. Climate change suggests the weather factors to cause these storms may become more common. Localized storms in the summer have become more intense since the 1970s while it is raining less often; droughts last longer and some dry areas are expanding. While the odds may become more favorable weatherwise, there is no strong statistical signal that points to a clear trend in the frequency of haboobs in the U.S. Southwest.
Steve Ackerman and Jonathan Martin, professors in the UW-Madison department of atmospheric and oceanic sciences, are guests on WHA radio (970 AM) at noon the last Monday of each month. Send them your questions at stevea@ssec.wisc.edu or jemarti1@wisc.edu.