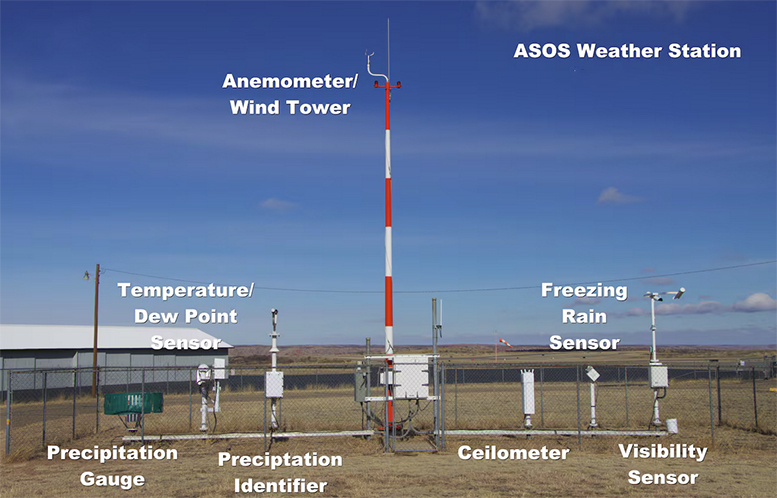
The weather observing stations of the National Weather Service operate in fully automatic mode and have sensors that measure visibility.
National Weather Service (NWS) Automated Surface Observing System (ASOS). (Photo credit: NOAA/NWS)
These instruments sense the forward scattering characteristics of light to measure the extinction coefficient of a high intensity beam directed at a volume of air close to the sensor. This provides an accurate measurement over a range of visibilities. The use of light within the visible spectrum also allows the sensor to simulate human perception of visibility.
There are a smaller number of stations where there is still a human observer to estimate visibility (e.g. at airfields). When people make the measurements, they are estimating the maximum distance away that they can see an object located near or on the ground. The object should be identifiable against the background. If the visibility varies with direction, the lowest value is reported.
A person with 20/20 vision who is about 5 feet tall can see a horizontal distance of about 3 miles along a flat ground surface. The human eye is more sensitive and can see a greater distance, but 3 miles is the point at which Earth’s curvature bends away. The instrument observations employ physics and are not concerned with Earth’s curvature.
We are all interested in horizontal visibility as it has major implications for transportation. The measurement is made at weather stations since visibility is dependent on current weather.
Horizontal visibility near the ground is one of the observations plotted on a station model. It is measured in fractions of a mile, unless there is an obstruction due to current weather conditions, such as fog, rain or smoke. If the visibility is above 10 miles, the values are either omitted from the map or listed at 10 miles.
Steve Ackerman and Jonathan Martin, professors in the UW-Madison department of atmospheric and oceanic sciences, are guests on WHA radio (970 AM) at 11:45 a.m. the last Monday of each month. Send them your questions at stevea@ssec.wisc.edu or jemarti1@wisc.edu.
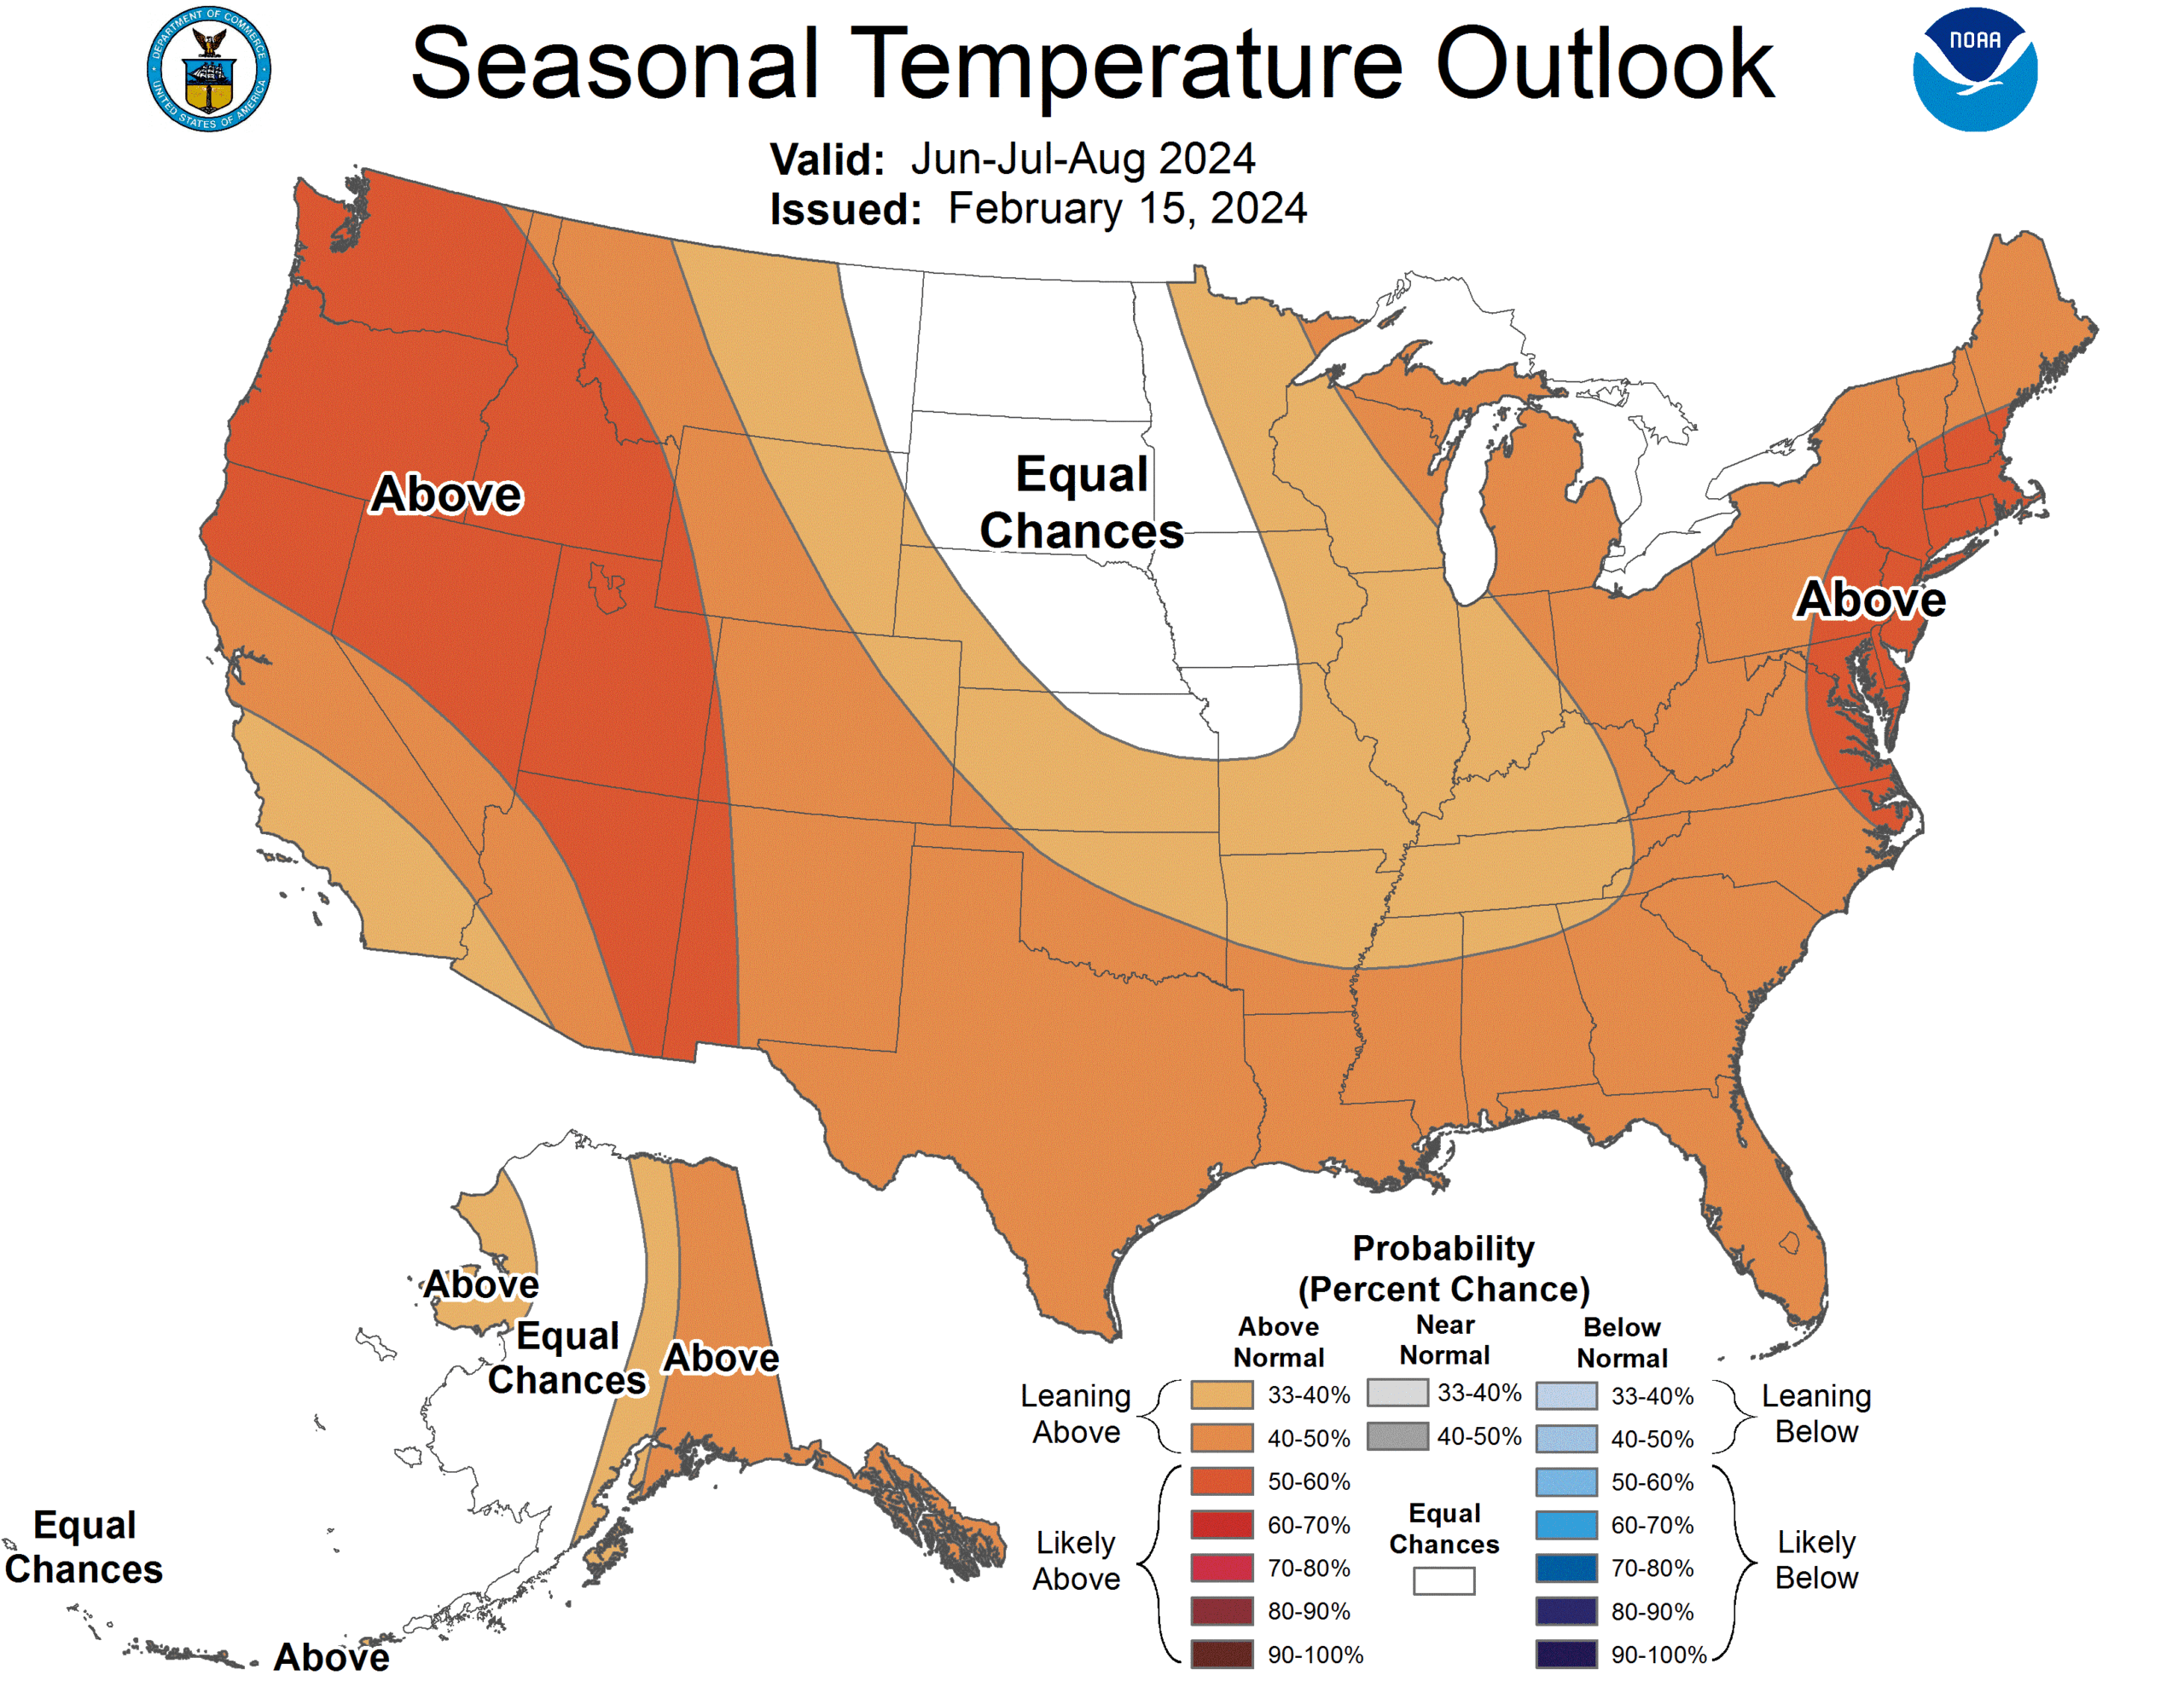
Changes in the weather patterns that brought record-breaking warm temperatures to the Madison area this winter might also mean that a warmer-than-usual summer lies ahead.
Temperature Outlookfor June, July and August (Image credit: NOAA Climate Prediction Center)
There’s a fair chance that temperatures could rise above normal in June, July and August, and even into early fall, climate scientists say.
“Looking at the outlook for meteorological summer, the three-month period including June, July and August, the probabilities of above-normal temperatures are slightly greater than one-third, or between 33 and 40%,” said Dan Collins, lead climate scientist for the National Oceanic and Atmospheric Administration’s most recent Climate Prediction Center seasonal outlook.
“Later in the summer, the seasonal outlook increases the chance of above-normal temperatures to greater than 40% for the July, August and September period,” Collins said.
Just how high the mercury could rise, it’s not possible to say. Official predictions do not say what exactly “above normal” temperatures could mean, Collins said.
However, Madison’s recent wintertime high temperatures — some into the high 60s — are not directly linked to what’s to come this summer, said Steven Ackerman, emeritus professor for the Department of Atmospheric and Oceanic Sciences and the retired vice chancellor for research and graduate education at UW-Madison.
“This unusual winter we’ve been having is partially due to the El Niño (climate pattern) that we’ve had that’s been pretty strong,” Ackerman explained.
But NOAA recently declared this El Niño is breaking down, he said, “and that means in the summertime the outlook is for ‘neutral’ conditions.”
“Neutral” means that the El Niño year — when the tropical Pacific is warmer than normal — is transitioning to a La Niña year, “which is pretty much the opposite,” Ackerman said. In that “neutral” scenario, “Wisconsin is typically above average in regards to temperature, and pretty much near normal in regards to precipitation,” he said.
“What we typically see after an El Niño is both the minimum temperatures go up as well as the maximum temperatures. And what we’ve been seeing in general is the minimum temperatures seem to be warmer than the increase in the high temperatures during summertime,” Ackerman said. “All of this is sitting on top of a world that is warming.”
Daily high temperatures in Madison for the month of June from 1991 to 2020 ranged from 75 to 82 degrees Fahrenheit, according to the National Weather Service. Low temperatures in June during those same years ranged from 53 to 61 degrees, with steady increases through the month.
Daily normal highs in July from 1991 to 2020 were consistently at 82 degrees, and lows hovered around 61 or 62 degrees. Daily normal El Niño temperatures for August were similar during that time, though they dropped several degrees toward the end of the month.
Last summer, however, was a different story. As Ackerman and UW professor Jonathan Martin, co-authors of the “Ask the Weather Guys” column, which runs on Mondays in the Wisconsin State Journal, wrote in early January: “Our meteorological summer in 2023 was the fifth-driest summer on record (since 1895). An intense heat wave hit in August, peaking from Aug. 22 to Aug. 24. Temperatures reached more than 100 degrees in many areas across the state.”
Wildfire smoke from Canada in late June also was an extreme weather factor in 2023, causing many people to curb outdoor activities and forcing the cancellation of outdoor summer events for several days.
If temperatures do soar in the coming summer and residents crank up the window fans or air conditioning, Madison Gas and Electric is equipped to serve any increased needs for electricity, said MGE communications manager Steve Schultz.
“MGE has sufficient capacity to meet the energy needs of our customers this summer, even if demand is higher overall, and we prepare for all sorts of weather conditions,” he said.
“Utilities are required to have enough generation capacity to provide power to all customers when demand for power is at its peak, or highest. For example, on the hottest day of the year when everyone is running their air conditioners,” Schultz said. “In Wisconsin, utilities also are required to have a reserve capacity margin above what they need to serve all customers when demand is at its peak.”
Under current predictions, precipitation in the Madison area is expected to be close to normal this summer. In the month of June from 1991 to 2020, that meant 5.28 inches; in July and August during those same years, 4.51 inches and 4.16 inches respectively.
“I hope we get adequate precipitation at timely intervals,” said Ed Hopkins, assistant state climatologist at the UW-Madison department of Atmospheric and Oceanic Sciences.
“Not a deluge in one day and nothing for the next month. It would be wonderful to have 1 inch of rain a week here in the corn belt, for the development of crops.”
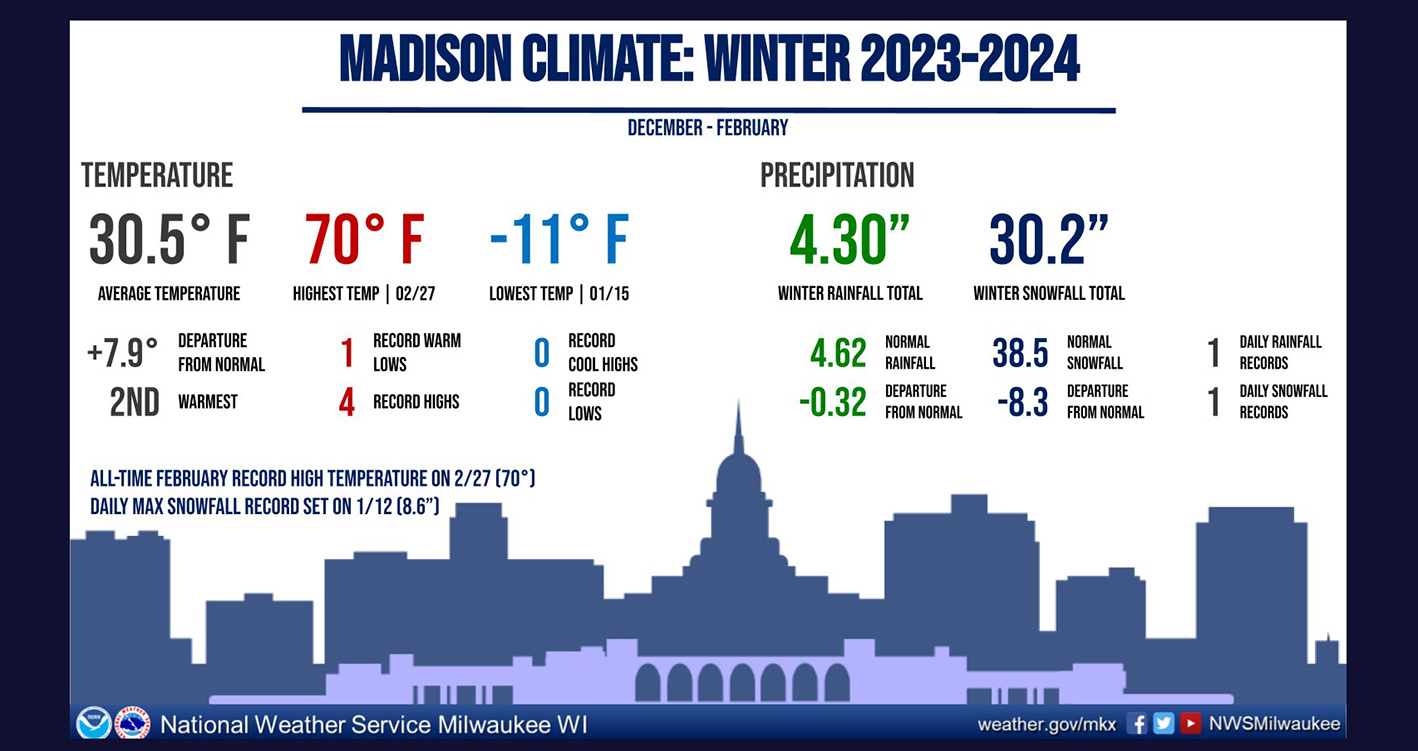
We are now past the end of the meteorological winter, which consists of the months of December, January and February.
NWS winter weather statistics for Madison Wisconsin
This season has been a remarkably mild one for most of its duration. With the exception of a week of desperate cold in mid-January, there was hardly any cold air to speak of in southern Wisconsin all winter. In fact, Madison was 9.5 degrees above normal for December, 3.5 degrees above normal for January (reduced because of the cold snap Jan. 14-21, during which the temperature was 14 degrees below normal!) and 11 degrees above normal for February.
All together this means we were 7.9 degrees above normal from Dec. 1 through Feb. 28. (We don’t count leap days.)
Over the wider region, this was the warmest winter in the past 132 years at a vast majority of locations throughout Wisconsin and Minnesota, and over northeast Iowa and most of northern Michigan.
As measured by the areal extent of air colder than minus 5 centigrade (23 Fahrenheit) at 850 millibars (about 1 mile above the surface), this was the third-warmest winter in the past 76 seasons, only slipping from second to third place on the last day of the tally, Feb. 28.
No matter how one looks at this winter — locally, regionally or hemispherically — it was one of the warmest in a century. Current guidance from the Climate Prediction Center suggests about a 50% chance of the unusual warmth persisting, though with some interruptions, through meteorological spring, March through May. We would not be surprised, however, to see at least a couple additional examples of winter before we finally see this mildest of winter seasons come to its end.
Steve Ackerman and Jonathan Martin, professors in the UW-Madison department of atmospheric and oceanic sciences, are guests on WHA radio (970 AM) at 11:45 a.m. the last Monday of each month. Send them your questions at stevea@ssec.wisc.edu or jemarti1@wisc.edu.
The stratosphere, which begins approximately 6 miles above the cold poles and 10 miles above the tropics, is where the temperature increases with altitude. Temperatures increase because ozone molecules in the stratospheric ozone layer absorb solar ultraviolet energy within the stratosphere. Air flow in the stratosphere is much less turbulent than in the troposphere. For this reason, jet aircraft pilots like to cruise at stratospheric altitudes so the flight is less bumpy. In polar regions, the top of the stratosphere extends upward to around 30 miles.
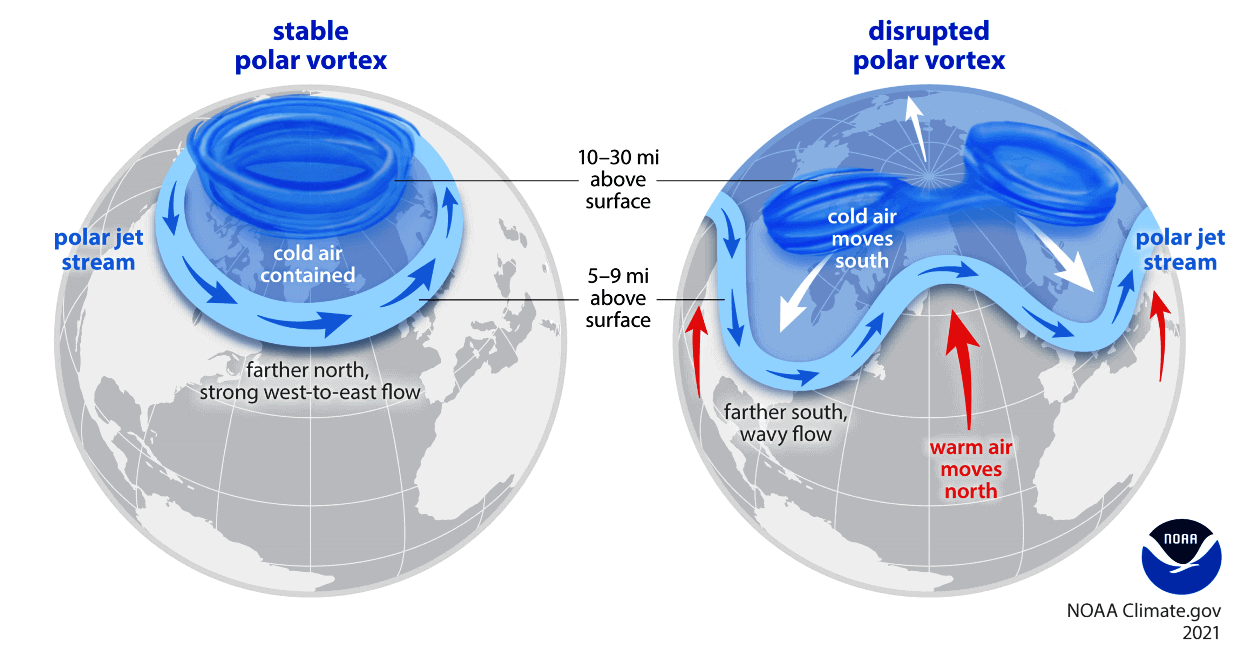
The polar vortex is a band of strong winds high in the atmosphere that spins counterclockwise around the North Pole. At the southern edge of the vortex is the polar jet stream, which separates warm air to its south from increasingly colder air to its north.
A strong/stable polar vortex usually means strong polar circulation and jet stream. This locks the colder air into the Arctic Circle, creating milder conditions for most of the United States. In contrast, a weak/disrupted polar vortex creates a weak jet stream pattern. As a result, it has a harder time containing the cold air, which can now escape from the polar regions into the United States. (Image credit: NOAA Climate.)
A sudden stratospheric warming, or SSW, occurs in the winter, when the polar stratosphere warms and the winds that normally flow from west to east around the pole weaken dramatically and even reverse direction. This phenomenon occurs about six times per decade and leads to a breakdown of the polar vortex. SSWs can cause the polar night jet to weaken, which allows cold air near the polar cap to expand into the middle latitudes.
This year has seen an interesting arctic stratospheric pattern — a major SSW happened twice this year, once in mid-January and again at the end of February. These SSWs warm the arctic stratosphere and decelerate the polar vortex. This is really good news for arctic total ozone levels, since SSWs increase arctic ozone by large amounts and these high amounts persist into spring and summer, decreasing the amount of ultraviolet energy that can reach the surface.
Steve Ackerman and Jonathan Martin, professors in the UW-Madison department of atmospheric and oceanic sciences, are guests on WHA radio (970 AM) at 11:45 a.m. the last Monday of each month. Send them your questions at stevea@ssec.wisc.edu or jemarti1@wisc.edu.
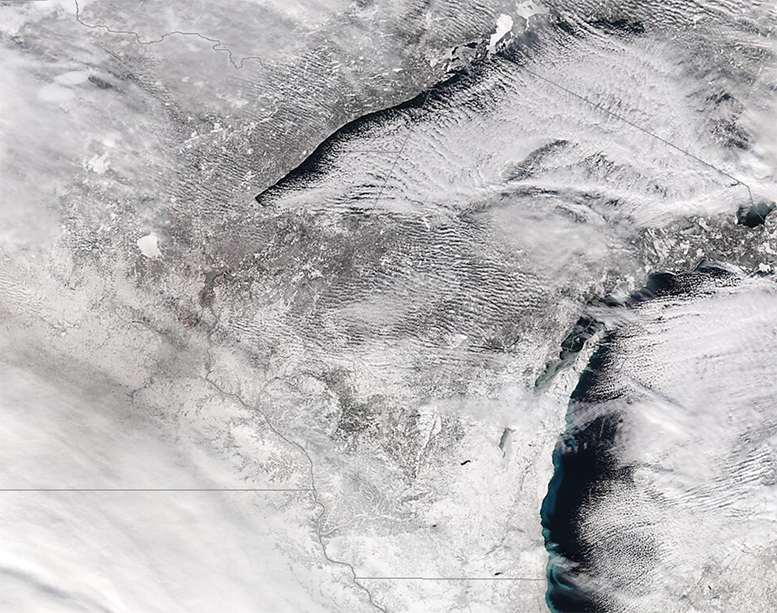
Since the beginning of the 2023-24 snow season, Madison and Dane County have received approximately 32 inches of snow.
Snow covered view of Wisconsin on January 17th, 2024 via VIIRS Today.
Snow is a form of solid water, and water is the only substance that occurs naturally in all three phases — solid, liquid and invisible gas — in the Earth’s atmosphere. Of course, that means that the 32 inches of snow began as the equivalent amount of water in the invisible vapor (gas) phase before it transformed into solid water.
Everyone knows that melting ice into liquid water requires energy. Not surprisingly, energy is also required to transform liquid water into water vapor, the familiar process of evaporation. The particular amounts of energy needed to accomplish these changes of phase are known as latent heats — the latent heat of melting for the first one and the latent heat of evaporation for the second.
When a cloud of invisible water vapor condenses into a puddle of liquid water, the latent heat of condensation (equal to the latent heat of evaporation) is released to the environment. Also, when that puddle freezes into ice the latent heat of fusion (equal to the latent heat of melting) is similarly released, incoherently, to the environment.
Since we know the depth of liquid equivalent precipitation involved in delivering us 32 inches of snow since Dec. 1, the area of Dane County and the latent heats of condensation and fusion, we can calculate how much energy has been released to the atmosphere in the production of that much snow. Without providing the details of the calculation, we can report that the amount of energy involved could power the entire Madison metro area for approximately seven years!
Clearly, there are huge amounts of energy involved.
Steve Ackerman and Jonathan Martin, professors in the UW-Madison department of atmospheric and oceanic sciences, are guests on WHA radio (970 AM) at 11:45 a.m. the last Monday of each month. Send them your questions at stevea@ssec.wisc.edu or jemarti1@wisc.edu.