A tornado is a powerful column of winds that rotate around a center of low pressure. The winds inside a tornado spiral inward and upward, often exceeding speeds of 300 mph. We don’t know if a particular storm will produce a tornado but we do know the necessary conditions needed for tornado formation.
The required conditions for a thunderstorm to produce a tornado are warm humid air near the surface with cold dry air above. These conditions make the atmosphere very unstable, in the sense that once air near the ground is forced upward, it moves upward quickly and forms a storm. Severe thunderstorm conditions also include a layer of hot dry air between the warm humid air near the ground and the cool dry air aloft. This hot layer acts as a lid that allows the sun to further heat the warm humid air, making the atmosphere even more unstable.
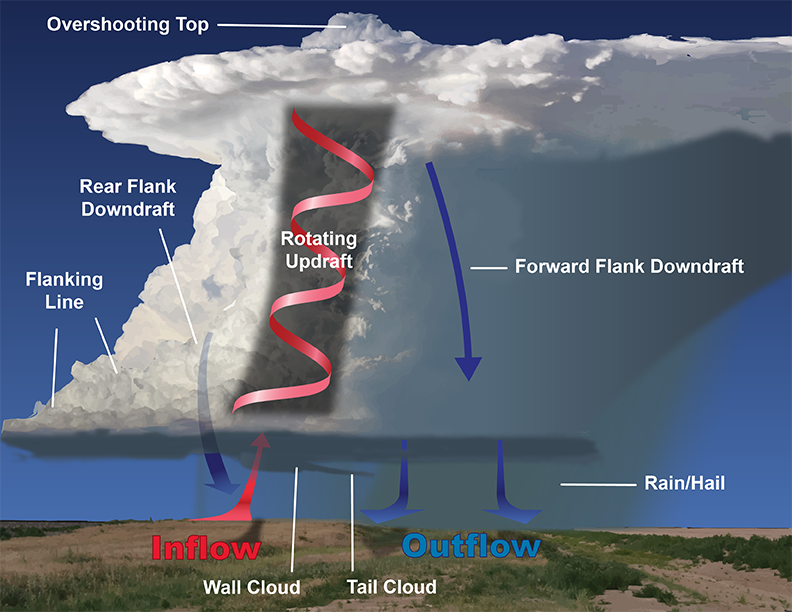
To form a tornado, the host thunderstorm also must rotate. This happens in a storm when wind at the ground is moving in a different direction and speed than the air above. The change in wind speed and direction with height is known as wind shear. This wind shear develops the rotation in the thunderstorm needed for tornado formation.
Once formed, tornadoes exhibit a typical four-stage life cycle. The first stage is the organizing stage, during which a funnel cloud picks up debris as it reaches the surface and widens. The mature stage follows when the tornado is often at its peak intensity and width. The tornado reaches the shrinking stage when its funnel narrows, and it ends with a decaying or “rope” stage. At this point, the funnel thins out to a very narrow, ropelike column, after which it eventually dissipates.
Steve Ackerman and Jonathan Martin, professors in the UW-Madison department of atmospheric and oceanic sciences, are guests on WHA radio (970 AM) at noon the last Monday of each month. Send them your questions at stevea@ssec.wisc.edu or jemarti1@wisc.edu.