Wind speed and direction are variables that change over space and time, and conditions can change considerably from month to month, as well as from year to year. Scientifically assessing any long-term changes in weather elements requires a long-term data set of accurate measurements. Temperature data goes back hundreds of years, and even thousands of years, using ancillary data such as from tree rings.
Wind is a more difficult parameter to study and analyze. The observations of wind speed and direction need to be made at the same height above the surface. The type of surface also impacts the measurement, as the wind sensor should not be too close to trees or buildings. Finally, large annual fluctuations make long-term trends difficult to detect.
Some research has indicated that between 1978 to 2010, the average global wind speeds decreased by approximately 2.3 percent per decade. A 2019 study found that after 2010, global average wind speeds had increased from 7 miles per hour to 7.4 miles per hour.
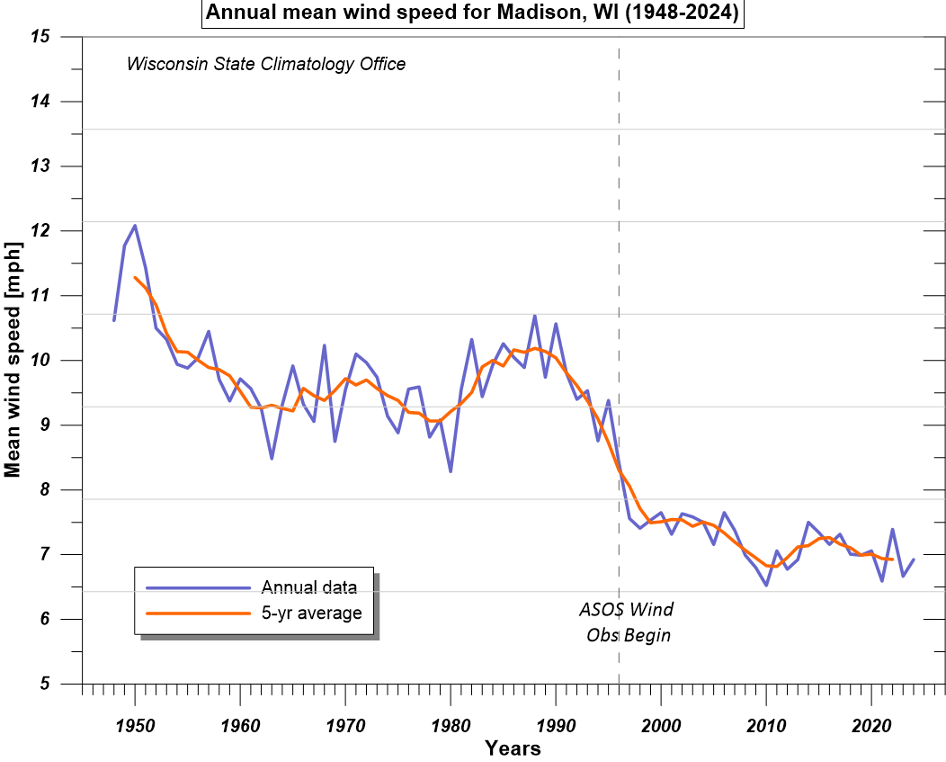
To address this question with respect to our state, we turned to the Wisconsin State Climate Office and send thanks to assistant state climatologist Dr. Ed Hopkins for his assistance. His careful analysis used wind observations from 1948 to 2023/24 for Madison, Milwaukee, La Crosse, Eau Claire, and Green Bay. The trend over the entire period showed a decreasing average wind speed at all the stations. The observations at La Crosse also had a decreasing trend but also had more variation over the period. A large portion of these decreasing trends in wind speed is exhibited in the period prior to the installation of Automated Surface Observing Systems (ASOS), which occurred in the mid-1990s. After that installation, the trend in decreasing wind was much smaller or showed nearly no trend in those weather stations.
Steve Ackerman and Jonathan Martin, professors in the UW-Madison department of atmospheric and oceanic sciences, are guests on WHA radio (970 AM) at noon the last Monday of each month. Send them your questions at stevea@ssec.wisc.edu or jemarti1@wisc.edu.