Why does the severe weather threat increase as spring and summer approach?

As the threat of winter snows recedes across the country, it is replaced by the threat of severe weather (i.e. thunderstorms with hail, damaging winds and tornadoes).

A visualization of the Northern Hemisphere’s polar jet stream swirling weather patterns from west to east across North America. Visualization made with data from NASA’s MERRA dataset. (Image credit: NASA’s Goddard Space Flight Center)

The severe weather season, though broadly spanning March through August across the United States, is actually quite regional. It begins in March in the southern states, moves to the southern Plains during April and May, and then further north toward the Great Lakes states during the summer.

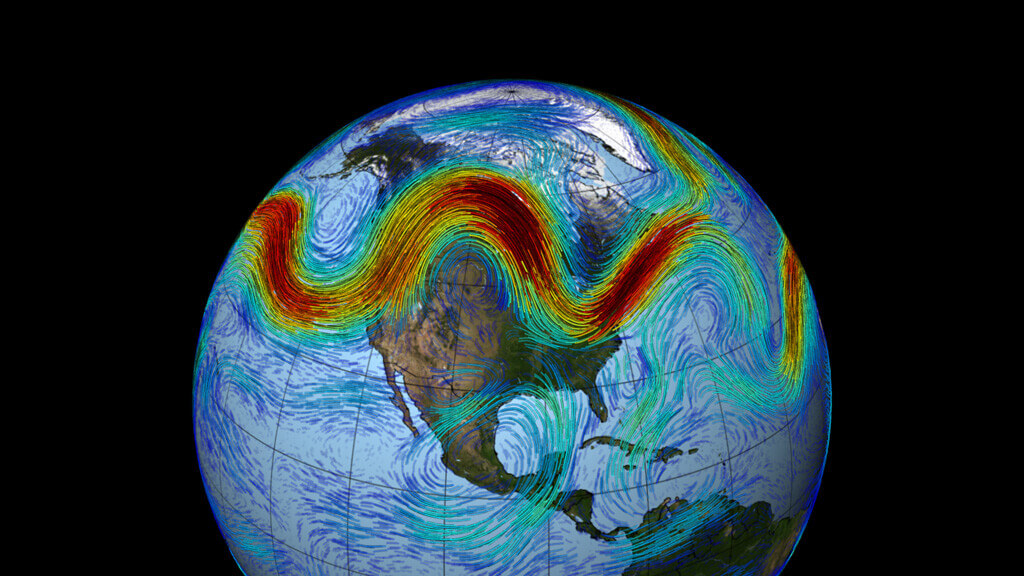
One of the basic underlying reasons for this northward migration of the severe weather threat during the spring and summer is the fact that the jet stream follows a similar seasonal cycle.

The jet stream is a ribbon of high wind speeds located near the top of the troposphere, about 6 miles above the surface of the Earth. The jet stream position is anchored to the southern edge of the dome of cold air that is centered on the North Pole. During the depths of winter, that cold dome expands considerably, extending nearly to the Gulf of Mexico. As the winter ends and spring approaches, the hemisphere begins to warm up and the cold dome shrinks dramatically. Its southern edge moves to central Canada by early summer.

The jet stream is associated with vigorous vertical circulations — upward and downward motions. The upward vertical motions are instrumental in producing thunderstorms. Thus, when the jet stream migrates northward as the weather warms in spring and summer, so does the greatest concentration of severe weather outbreaks.

This very sort of situation characterized the severe outbreak last weekend in several southern states.

Steve Ackerman and Jonathan Martin, professors in the UW-Madison department of atmospheric and oceanic sciences, are guests on WHA radio (970 AM) at noon the last Monday of each month. Send them your questions at stevea@ssec.wisc.edu or jemarti1@wisc.edu.

Category: Meteorology, Seasons, Severe Weather

Comments Off on Why does the severe weather threat increase as spring and summer approach?

What can I do with home precipitation observations?

Rain gauge used for CoCoRHaS. (Photo credit: Steve Ackerman, Weather Guy)

Precipitation can widely vary over a region; consequently, local observations of precipitation are valuable weather observations. Contributing your personal observations via a community-based network of volunteers can help with weather and river forecasts.

One well-known observation network is the Community Collaborative Rain, Hail, and Snow Network, or CoCoRaHS (https://www.cocorahs.org). This is a group of volunteers working together to measure precipitation across the U.S., Canada, Puerto Rico, U.S. Virgin Islands, Guam, and the Bahamas. CoCoRaHS began on June 17, 1998 and now has over 26,000 observers. The variability of precipitation is such that observers are always needed. Joining is easy at https://www.cocorahs.org/application.aspx. There are many observers in Wisconsin and the surrounding region. Once you begin to participate, it is interesting to see the measurements of other observers in your area.

Participation measurement requires only a rain gauge and the CoCoRaHS web site has suggestions on ones to purchase as well as guidelines on where to set up your gauge.  Observers report the gauge’s measured daily 24-hour precipitation totals at 7 am. These are manual rain gauges, as CoCoRaHS does not use automated rain gauges due to the variation in the quality and reporting of the automated weather stations. These manual precipitation gauges are accepted by the National Weather Service (NWS) as comparable to their official instruments. 

The advantage of many automated rain gauges is that they can record the time and relative intensity of precipitation. Some CoCoRaHS observers record this in their notes but the official data are the 24-hour manual rain gauge reports.

Join CoCoRaHS and contribute observations that will be of interest to the community, hydrologists, NWS, the Wisconsin State Climatology Office, UW-Extension, and media outlets such as The Midwest Farm Report.

Steve Ackerman and Jonathan Martin, professors in the UW-Madison department of atmospheric and oceanic sciences, are guests on WHA radio (970 AM) at noon the last Monday of each month. Send them your questions at stevea@ssec.wisc.edu or jemarti1@wisc.edu.

Category: Meteorology

Comments Off on What can I do with home precipitation observations?

How do we measure global cloud cover?

Because clouds are involved in the global water cycle as well as our planet’s energy gains and losses, they constitute an important component of our atmosphere, weather, and climate.

Determining global cloud cover requires observations that cover the entire planet. Observations from weather satellites provide a modern estimate of the global cloud cover. These satellites are operated by several countries and their data is shared through international agreements. Discrimination between clear and cloudy regions is a crucial first step in most applications of satellite data, such as estimating ocean temperature or assessing the health of land vegetation.

Annual average total cloud amount over the Earth (period 1991 to 1995) derived from the ISCCP data sets (Image credit: International Satellite Cloud Climatology Project, NASA)

Clouds are generally brighter and colder than the underlying surfaces. During daylight most clouds are detected via reflection of visible and near infrared energy coming from our sun.  At visible wavelengths, snow surfaces can be as bright as clouds, making cloud detection a bit more challenging. But at other wavelengths, ones our eyes cannot detect, clouds and snow appear very different.  During day, clouds are often colder than the underlying service and so infrared observations help in cloud detection. At night, contrasts in temperatures between cloud and the surface are sufficient for the detection of most middle and high-altitude clouds. However, there can be challenges with low altitude clouds, where the ground can become colder or at the same temperature as the clouds at night.

Global cloud cover is approximately 65% with the average cloud cover over ocean exceeding the average over land. Cloud cover over land tends to be greater in daytime than at night, while the ocean shows little day–night difference.

Modern satellite observations can also be used to assess additional cloud properties, such as altitude and whether the clouds are composed of ice crystals or liquid water droplets.

Steve Ackerman and Jonathan Martin, professors in the UW-Madison department of atmospheric and oceanic sciences, are guests on WHA radio (970 AM) at noon the last Monday of each month. Send them your questions at stevea@ssec.wisc.edu or jemarti1@wisc.edu.

Category: Climate, Meteorology

Comments Off on How do we measure global cloud cover?

What does the National Weather Service do?

The National Weather Service (NWS) is a subdivision of the National Oceanic and Atmospheric Administration (NOAA), which is an agency within the United States Department of Commerce.  It is the nation’s official source of weather information. The NWS’s primary responsibility is providing weather forecasts, warnings, and other weather-related services to the public. The NWS plays a crucial role in safeguarding lives and property as the office collaborates with emergency management agencies, the media, and private industries to ensure that the public receives good weather information in a timely manner. The NWS disseminates weather warnings and advisories through a wide variety of communication channels, such as radio, television, websites, and mobile apps.

Kelli Barendse, meteorologist at the National Weather Service station in La Crosse, monitors an incoming storm on Tuesday, Feb 11. Station employees interpret data and trends to alert the public and local officials of weather conditions. (Photo credit: Saskia Hatvany, River Valley Media Group)

The NWS gathers and analyzes weather data from various sources, including a vast network of satellites, airplanes, radar, surface weather observations, and ocean buoys. These data, along with computer models, enable meteorologists at NWS to generate accurate and up-to-date weather forecasts, severe weather advisories, and warnings across the United States. The NWS includes a network of local weather forecast offices throughout the country. These offices have trained meteorologists who monitor regional weather conditions and generate accurate timely weather forecasts and alerts as needed.

These NWS forecasts and weather alerts are accurate, widely available and free to the public. They impact everyday life. These forecasts also support industries that rely on weather forecasts. Private industries, including TV forecasters, AccuWeather, and the Weather Channel, all use NOAA data and NWS forecasts. NOAA and NWS provide weather and climate data and forecast models that are a national treasure. The weather and climate models produced continuously by the NWS are accurate and robust. It is impossible and inefficient for private industry to provide comprehensive weather data in a reliable way that is also freely accessible to everyone.

Steve Ackerman and Jonathan Martin, professors in the UW-Madison department of atmospheric and oceanic sciences, are guests on WHA radio (970 AM) at noon the last Monday of each month. Send them your questions at stevea@ssec.wisc.edu or jemarti1@wisc.edu.

Category: History, Meteorology

Comments Off on What does the National Weather Service do?

Why does the United States have a National Weather Service?

While successfully prosecuting the Civil War against the Confederacy, Gen. Ulysses S. Grant* had learned that weather information – even if NOT in the form of a forecast – was extremely valuable for operations.

Portrait of Increase Lapham. Wisconsin’s first published scientist, Dr. Lapham was instrumental in helping to establish the National Weather Service. (Photo credit: Wisconsin Historical Society archives)

Coincidentally, in the years following the war, Dr. Increase Lapham, a Milwaukee scientist, lobbied Milwaukee’s congressman, Gen. Halbert Paine, to push for establishment of a storm warning service for the Great Lakes. 

On February 2, 1870, Halbert introduced a Joint Congressional Resolution requiring the Secretary of War “to provide for taking meteorological observations at the military stations in the interior of the continent, and at other points in the States and Territories…and for giving notice on the northern lakes and on the seacoast, by magnetic telegraph and marine signals, of the approach and force of storms”.

On February 9, 1870 (155 years ago last Sunday) a sympathetic President Ulysses S. Grant* signed the resolution into law and what is now known as the National Weather Service was born. 

Thus, the service began its life within the U.S. Army Signal Service’s Division of Telegrams and Reports for the Benefit of Commerce.  Observations officially began on November 1, 1870.  Exactly a week later, on November 8, Dr. Lapham issued the Service’s first storm warning on the approach of a storm over Lake Michigan. 

On October 1, 1890, at the request of President Benjamin Harrison, Congress passed a law transferring the meteorological responsibilities of the Signal Service to the newly-created U. S. Weather Bureau which was housed in the Department of Agriculture.  The Weather Bureau became the National Weather Service in 1970 with the creation of the National Oceanic and Atmospheric Administration (NOAA). 

The NWS provides value, in terms of forecasts and warnings, that by reasonable estimates account for savings of well over $10B each year to commerce across our vast country.  It is important to be reminded of its exceptional value to us all given current developments in our national politics.

*Interesting footnote: An online version of General Grants memoirs is available at https://www.gutenberg.org/files/4367/4367-h/4367-h.htm 

Steve Ackerman and Jonathan Martin, professors in the UW-Madison department of atmospheric and oceanic sciences, are guests on WHA radio (970 AM) at noon the last Monday of each month. Send them your questions at stevea@ssec.wisc.edu or jemarti1@wisc.edu.

Category: History, Meteorology

Comments Off on Why does the United States have a National Weather Service?