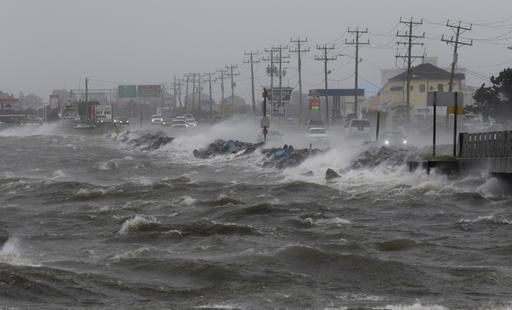
Water from Roanoke Sound pounds the Virginia Dare Trail in Manteo, NC, Saturday, as Tropical Storm Hermine passes the Outer Banks. Hermine lost hurricane strength over land but intensified along the Atlantic Coast. (Photo credit: Tom Copeland, Associated Press)
On Friday Hurricane Hermine made landfall in Florida, making it the first to make landfall in the state in more than a decade.
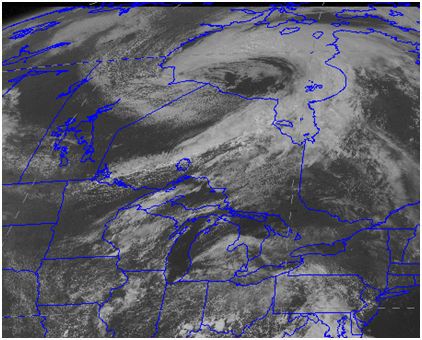
Hermine, which weakened to a tropical storm shortly after landfall as is commonly the case with weak hurricanes, was poised to redevelop and pose a threat to the Mid-Atlantic states and possibly southern New England into the middle of the week.
Eighty-one years ago, nearly to the day, the famous Labor Day Hurricane of 1935 struck Florida with greater intensity than any other landfalling hurricane in the country’s history.
While Hermine had sustained winds of about 75 mph and dropped nearly 17 inches of rain in the Tampa/St. Petersburg area, the Labor Day Hurricane made landfall with sustained winds near 185 mph.
Both storms developed within days of Sept. 12, the date of the average peak frequency for such storms in the Atlantic Basin. Though the number of tropical cyclones in an average year numbers in the low teens, these storms are deserving of attention because they can wreak enormous damage to life and property.
They also play a substantial role in ventilating the tropical ocean and mixing heat from the tropics, where an annual surplus accumulates, to the high latitudes where an annual deficit stands in need of remedy.
It may seem surprising given our location in the middle of the North American continent, but hurricane research, employing both satellite observations and theoretical advances, at UW-Madison has led the way toward improved understanding and forecasting of these powerful storms.