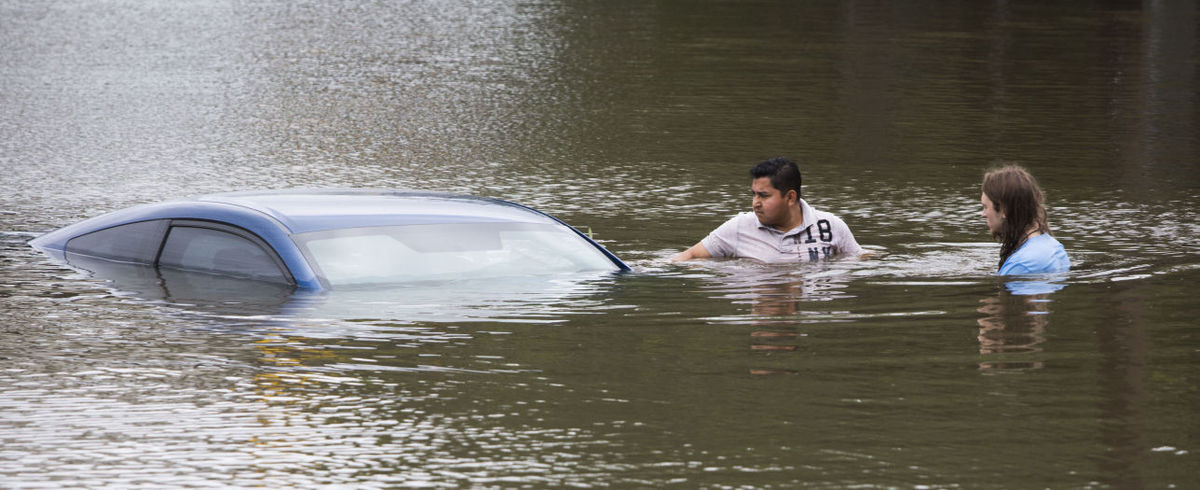
Roberto Salas, left, and Lewis Sternhagen check a flooded car in Houston on May 26. This spring the Houston area has experienced five separate rain events that have been classified as “once in a hundred year” events, which have a 1 percent chance (or a 1-in-a -100 chance) of occurring in any given year. (Photo credit: Associated Press)
In 2004, the Boston Red Sox won the World Series for the first time in 86 years and their loyal fans were ecstatic. In the very next year, the Chicago White Sox won their first World Series title in 88 years.
Never in the long history of baseball had two teams that had been denied championships for so long won those long-coveted titles in successive years. This circumstance was at least partially a function of the changes in baseball brought about by free agency — a fundamental change to the rules.
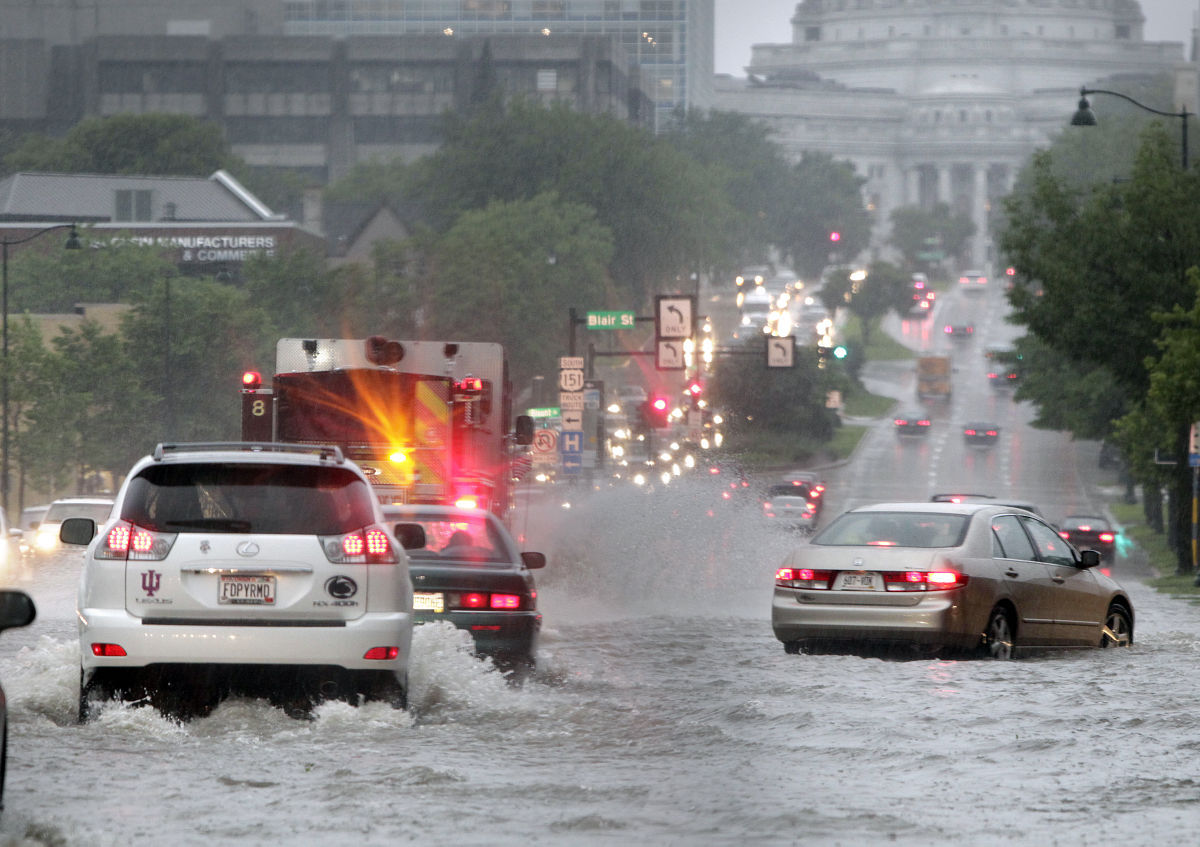
This spring the Houston area has experienced five separate rain events that have been classified as “once in a hundred year” events. A 100-year event has a 1 percent chance (or 1-in-a-100 chance) of occurring in any given year.
This designation is meant to suggest that the intensity of these events is not likely to return to Houston except every 100 years or so. Thus, to have experienced five such storms in a single season is extremely unlikely and points toward an alteration in the climate (a fundamental change in the “rules”) of the region.
In a similar way, readers might recall that here in Madison in March 2012 we recorded five days with temperatures at or above 80 degrees. In the prior 100 years, only five other March days had ever topped 80 degrees, so that was also exceptionally unusual and provided evidence also suggestive of a shift in the climate toward a warmer world.
As isolated incidents, these meteorological phenomena can be expected every so often even in an unchanging climate as there is a lot of internal variability in the atmosphere.
In the seemingly recurring sequence we have experienced in the past couple of decades, however, there is little doubt that such events are among the fingerprints of a changing climate — a reality that we simply must confront in a coordinated, scientifically informed manner. A great number of dedicated scientists at UW-Madison are actively seeking better understanding of the complicated weather/climate system.