
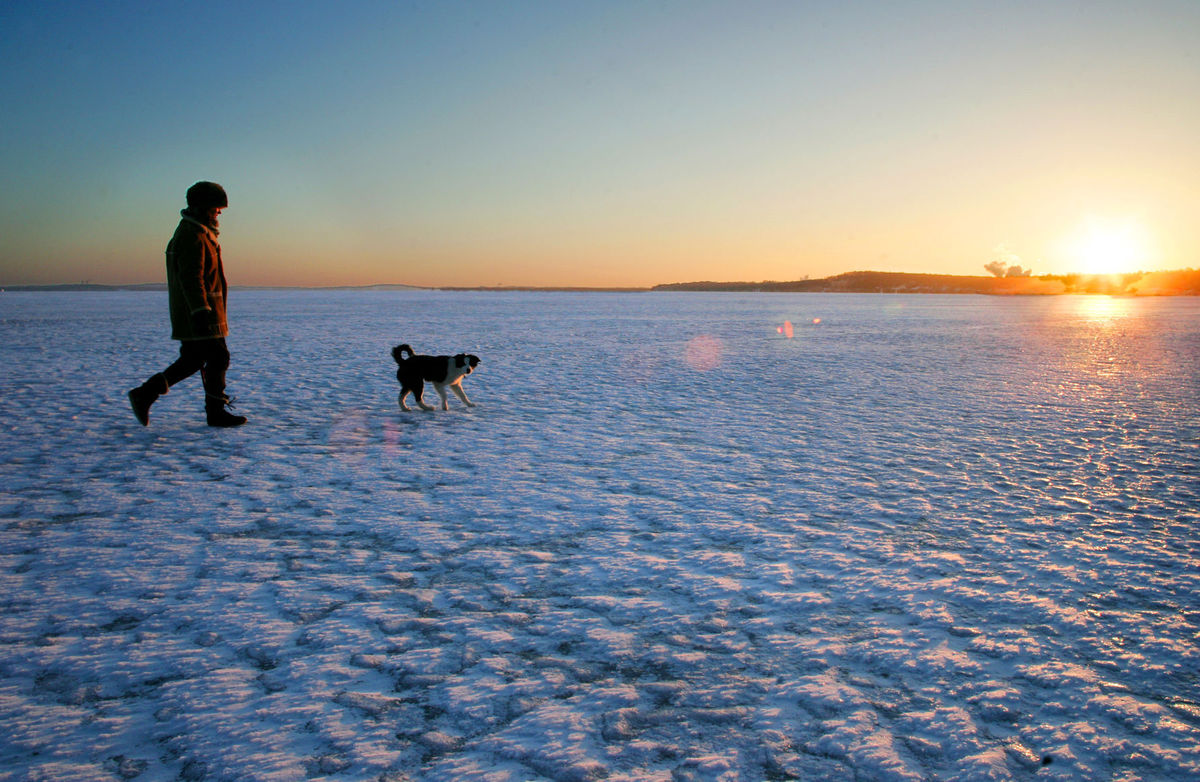
On certain mornings, in all seasons, the lowest temperature is often recorded just after sunrise. (Photo credit: State Journal Archives)
On certain mornings, in all seasons, the lowest temperature is often recorded just after sunrise. (Photo credit: State Journal Archives)
The observational evidence that our Earth is warming is overwhelming and unmistakable. Earth scientists agree that in the past 200-plus years, human activity has been a significant contributing factor to the observed increase in mean global temperatures. Scientists cannot explain this increasing temperature trend without incorporating human impacts, primarily the burning fossil fuels.
Svante Arrhenius, a Swedish scientist, was probably the first scientist to propose that burning fossil fuels could modify our global temperatures. He recognized that carbon dioxide (CO2), a byproduct of burning carbon-based substances such as natural gas, gasoline and oil, is like a greenhouse gas and that increasing the quantity of CO2 in the atmosphere through human activities could lead to a warmer Earth. He made this estimate in 1896. So, we have been aware of the fundamental physics of global warming for over 100 years.
This observed warming impacts ecosystems across the globe, including those in Wisconsin and the Great Lakes region.
The warmer winters enable some invasive species to survive the normally harsh season. As our river and lake waters warm, they become a less favorable environment for native cold-water fish species.
The growing season has lengthened by about one to four days per decade during the past 40 years in the Northern Hemisphere, especially at higher latitudes. This can have some positive impacts on agriculture and home gardening.
The duration of ice cover on lakes has decreased by about two weeks over the 20th century in the mid and high latitudes of the Northern Hemisphere. This reduces the ice fishing time enjoyed by so many Wisconsin families. The reduced time the ground is frozen impacts wintertime harvesting of our forests.
Instead of debating a well-known and well-understood fact concerning our changing climate, it is time for a healthy debate regarding what actions we should take in response to this reality and the associated environmental and societal impacts.
President Abraham Lincoln, who founded the National Academy of Sciences the same year he so eloquently extolled the virtues of “government of the people, by the people, and for the people” at Gettysburg, would surely condemn the imposition of willful ignorance on an issue of public concern.
No government, local or national, should intentionally obfuscate a science issue on which so many hard-working scholars have rendered conclusions. The change to the Wisconsin Department of Natural Resources’ website in reference to climate science this week is shameful.

The first efforts to harness emerging computing power to the problem of weather prediction, launched in the United States and Great Britain, were driven primarily by a desire to control the weather — accurate prediction was seen as an ancillary benefit. (Photo credit: John Hart, State Journal archives)
The urgency to defeat fascism in World War II resulted in an explosion of technological innovations. A good number of the resulting inventions have had direct application to weather forecasting, including radar and the rise of the computer.
It isn’t well known that the first efforts to harness this emerging computing power to the problem of weather prediction, launched in the United States and Great Britain, were driven primarily by a desire to control the weather.
A particularly strange vision of the future appeared in a lecture by British meteorologist Dr. Ernest Gold to the Royal Meteorological Society in April 1947. Gold’s lecture dragged recently developed nuclear capability, also a byproduct of the war, into the discussion.
Gold suggested, “It might eventually be possible to put at the forecaster’s disposal the means to make his forecast come right — to adjust the atmosphere by means of an appropriate release of atomic energy in the right place to counteract any tendency on its part to stray.”
He was effectively suggesting that by controlled nuclear explosion, the weather could be modified to allow the forecast to verify as correct. This suggestion sounds ridiculous to the present-day meteorologist, and likely to the general public as well. It does point out, however, that the revolution of numerical weather prediction, arguably one of the greatest technological advances of the second half of the 20th century, was christened in an intellectual environment characterized by an embarrassing lack of humility.

Alvaro Ceballos enjoys November’s mild weather as he stops to read at Vilas Beach on Lake Wingra on his way home from getting a haircut. Madison averaged 7.6 degrees above normal for the month, which ranked as the third warmest November on record. (Photo credit: Amber Arnold, State Journal)
Madison averaged 7.6 degrees above normal for the month, which ranked as the third warmest November on record (since 1870).
The warmest November here occurred in 2001, when the average temperature was 9.8 degrees above normal.
For the entire autumn season, defined as Sept. 1 through Nov. 30, Madison averaged 54.5 degrees, placing it behind only 1931 (56 degrees) as the second-warmest autumn on record.
Similar rankings for both the month of November (second-warmest ever) and full autumn season (second-warmest ever) were also set this year in Milwaukee.
Perhaps even more interesting is the fact that in Madison, which has a continuous 146-year temperature record, nine of the warmest 25 Novembers have occurred since 1994.
If, despite the fact that variation in November and autumn average temperature occurs, there were no discernible trend, these warmest Novembers would be distributed nearly equally throughout the 146-year record. Therefore, we could reasonably expect one such unusual November every six years or so.
Thus, to have had nine of them (54 years worth) in the last 22 years is far ahead of the expected pace. In a similar fashion, we should have expected to wait about 41 years to have experienced seven of the warmest 25 autumns but it has only taken 22 years.
These facts strongly suggest that the high frequency of warm Novembers and warm autumns since 1994 is not a result of random chance.
It appears instead to be a manifestation of the general warming of the planet associated with global climate change.

Ice floats in the Arctic near Svalbard, Norway, in April 2009. At the end of October 2016, the Arctic sea ice was at its lowest October coverage since satellite-based data records started in 1978.
While not quite a record-setting year like 2012, throughout much of 2016 the extent of sea ice was more than two standard deviations below the average. At the end of October the Arctic sea ice was at its lowest coverage for the month since satellite-based data records started in 1978.
This continues the recent decreasing trend observed in the Arctic over the last decade. As of November, the sea ice extent remains low over much of the Arctic Sea. In addition to having a smaller extent, the Arctic is losing it thickest and oldest ice. Scientists recognize that the decrease in sea ice is directly tied to the global warming that is being driven by human activity.
The decreasing ice can enhance this warming by what is referred to as a positive feedback. Sea ice is bright and reflects about 80 percent of the sunlight that falls on it, helping to keep the surface cool. When the ice melts, the ocean surface is exposed and is able to absorb the incident solar energy. This leads to a warming of the water and the air above, which can melt more ice, leading to an increased warming and more melting.
Since the sea ice is floating on the ocean, melting it does not cause the sea level to rise. Melting ice on land will cause the sea level to rise as it contributes to increased runoff. In addition, as the ocean waters warm, they expand, which further contributes to sea level rise.