Is carbon dioxide a major contributor to global warming?

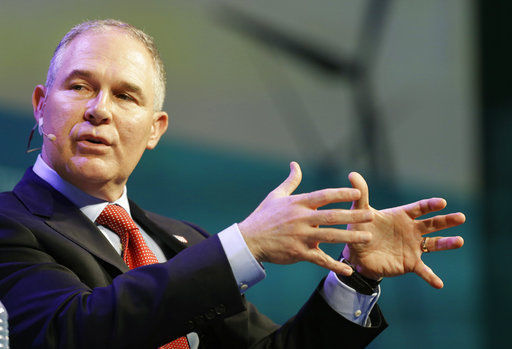
EPA Administrator Scott Pruitt, who recently stated on CNBC that he does not believe that carbon dioxide is a primary contributor to global warming, putting him at odds with scientific consensus and his own agency. (Photo credit: Melissa Phillip, Houston Chronicle)

The Earth’s atmosphere is a mixture of many different gases. Several of these gases are known as “greenhouse gases” because they share the characteristic of being excellent absorbers of infra-red radiation.

Such gases absorb radiation emitted by the Earth that would otherwise escape to space and cool the planet. Upon being absorbed, these gases re-emit a fraction of that energy back downward to the surface, keeping the planet warmer than it would otherwise be. In fact, our Earth would have an average temperature of about zero without these greenhouse gases.

The average temperature of the planet is 59 degrees, dramatically demonstrating the warming effect of these greenhouse gases.

Among the collection of greenhouse gases, carbon dioxide (CO2) is the one that has attracted the most attention with regard to global warming. This is likely because CO2 is a by-product of burning fossil fuels, the acknowledged predominant energy source for our nation’s and the world’s economy.

In the last 100 years, the accelerated use of fossil fuels has led to an increase in the CO2 concentration in the atmosphere from 300 to 400 parts per million (400 molecules of every one million are now CO2). The current concentration far exceeds anything the Earth’s atmosphere has experienced in at least the last 800,000 years.

Being a greenhouse gas, the more CO2 there is in the atmosphere, the greater the warming effect.

This basic physical fact is indisputably true. Thus, to hear the new administrator of the Environmental Protection Agency (EPA) assert that CO2 is not a “primary contributor” to global warming, as he did last week, represents a stunning display of willful ignorance.

It seems unlikely that Americans would tolerate the surgeon general of the United States suggesting that smoking does not cause cancer. Neither should we accept this recent statement by the EPA chief.

— Steve Ackerman and Jonathan Martin, professors in the UW-Madison department of atmospheric and oceanic sciences, are guests on WHA radio (970 AM) at 11:45 a.m. the last Monday of each month.

Category: Climate, Meteorology

Comments Off on Is carbon dioxide a major contributor to global warming?

How did this winter compare to others?

Now that the traditional winter season (December, January, February) is over, we can consider how this season stacked up against the preceding 69 winters in terms of its hemispheric intensity.

One way to measure this intensity is to consider the areal extent of air colder than 23 degrees at about one mile above the ground. For several years now, at UW-Madison we have been calculating this areal extent each day and, using those daily values, can calculate a seasonal average.

This year the season ended up being the 13th warmest in the last 69 cold seasons.

Evidence like this makes two points very clear. First, the evidence supports the scientific consensus that the planet is warming in a systematic way and that this warming is most likely a result of changes in the chemical composition of the atmosphere brought on by industrialization.

Second, there has been no “pause” in the warming trend the Earth has been experiencing in the last 100 years as is suggested by global warming skeptics.

We are currently examining the intensity of winters on a more regional basis using the same metric and will report on those results soon.

Steve Ackerman and Jonathan Martin, professors in the UW-Madison department of atmospheric and oceanic sciences, are guests on WHA radio (970 AM) at 11:45 a.m. the last Monday of each month.

Category: Meteorology, Seasons, Uncategorized

Comments Off on How did this winter compare to others?

Do atmospheric rivers occur over Wisconsin?


Total precipiatable water measured by water vapor sensors on satellites depicting an atmospheric river from February 2017. Credit: CIMSS

An atmospheric river is a term used to describe a relatively narrow region in the atmosphere that transports water vapor outside of the tropics northward.

They are typically a few thousand miles long and a hundred miles wide. There can be three to five of these “rivers” at any time covering the hemisphere.

Atmospheric rivers are apparent in satellite images and are often in the vicinity of fronts over the oceans. They transport large amounts of water. A common atmospheric river is one that transports water vapor from Hawaii to North America, sometimes nicknamed the “pineapple express.”

While these atmospheric rivers are made of water in the gas form, or water vapor, they can carry as much water as a dozen Mississippi Rivers. The features can transport water into storms and result in extreme precipitation events which cause severe flooding in western coastal regions of the world, including the West Coast of North America.

Much of the precipitation and resulting flooding occurring on the West Coast is from water vapor transported across the Pacific Ocean by these rivers of water vapor. While some of these events lead to flooding and mud slides, most precipitation events simply provide beneficial precipitation important to the region’s water supply.

Much of the water vapor transport to Wisconsin comes from the Gulf of Mexico and not the tropical Pacific Ocean. Water vapor transport by atmospheric river coming from the Pacific Ocean has to flow over the Rocky Mountains, where much of the precipitation falls out.

Steve Ackerman and Jonathan Martin, professors in the UW-Madison department of atmospheric and oceanic sciences, are guests on WHA radio (970 AM) at 11:45 a.m. the last Monday of each month.

Category: Uncategorized

Comments Off on Do atmospheric rivers occur over Wisconsin?

How does this current February warm spell rank?

A frozen lake is a public good for all.
Photo Credit: John Hart, WSJ

It’s no secret we have had some amazingly warm weather the past few days. After reaching 60 Fahrenheit Friday February 17, the temperature soared to 62 F Saturday in Madison, breaking the previous record for the date (57 F) set in 1981.

In Milwaukee, the record-shattering was even more extraordinary as the Saturday high of 67 F broke the old record for the date – set in 1877—by 10 degrees! In fact, Milwaukee’s high of 67 F was just one degree short of its all-time February record of 68 set on Feb. 11, 1999.

Madison’s 62 F on February 18 was only two degrees shy of its all-time monthly record of 64 F set on February 25, 2000.

These are clearly exceptional temperatures!

Combining Friday and Saturday’s warmth with what appears likely in the short-term forecast, both cities may be in the running to record another unusual meteorological event by Wednesday of this week.

It is quite rare for six consecutive days in February to have high temperatures of at least 50 F. This last occurred in Milwaukee in 2000 while the wait has been much longer in Madison – not since 1930!

The expansive ridge of high pressure that is responsible for our warm spell appears reluctant to move so we may well see the longest February warm streak in Madison since Herbert Hoover was living in the White House.

In addition, it is not inconceivable we could set a daily record on every one of those days. It is a welcome respite from winter and should serve as an encouraging reminder of what is to come.

Steve Ackerman and Jonathan Martin, professors in the UW-Madison department of atmospheric and oceanic sciences, are guests on WHA radio (970 AM) at 11:45 a.m. the last Monday of each month.

Category: Uncategorized

Comments Off on How does this current February warm spell rank?

How is the ice cover on the Great Lakes?

National Oceanic and Atmospheric Administration (NOAA) monitors and reports on the ice coverage of the Great Lakes.

The average concentration of ice on Lake Superior is currently 5.7 percent, compared to 4.6 percent last year and 55.5 percent in 2015.

Lake Michigan’s ice coverage is currently at 14.4 percent, compared to 11.9 percent in 2016 and 33.8 percent in 2015. Lake Huron’s coverage is 24.8 percent this year, compared to 13.7 percent and 75.8 percent in 2016 and 2015, respectively.

Lake Erie, the shallowest lake is currently at 14.3 percent ice coverage, compared to only 3 percent in 2016 and 95.2 percent in 2015. And finally, Lake Ontario ice coverage is 2.3 percent, compared to 0.4 percent in 2016 and 33.4 percent in 2015.

The density of liquid water depends on the water temperature. The density of water is highest at a temperature of about 40 degrees.

 During winter, lakes lose energy to the atmosphere as the water near the surface cools.

The density of the water near the surface increases and this surface water sinks because it is denser than the warmer water below.

Warmer water under the surface rises to replace this sinking water because of its smaller density. When all the lake water reaches a temperature of 40 degrees, further cooling of the surface water makes it colder than 40 degrees and, because it is now less dense than the water around it, it will float and continue to cool.

Once this surface water decreases to 32 degrees, the water freezes. The freezing then spreads downward into the lake and the ice thickens.

Freezing also first occurs along the shoreline, where the water is shallow. Before ice can form on the surface, the entire water column must first reach a temperature of 40 degrees, and this is likely to first occur along the shoreline.

Steve Ackerman and Jonathan Martin, professors in the UW-Madison department of atmospheric and oceanic sciences, are guests on WHA radio (970 AM) at 11:45 a.m. the last Monday of each month.

Category: Climate, Meteorology, Phenomena, Seasons

Comments Off on How is the ice cover on the Great Lakes?