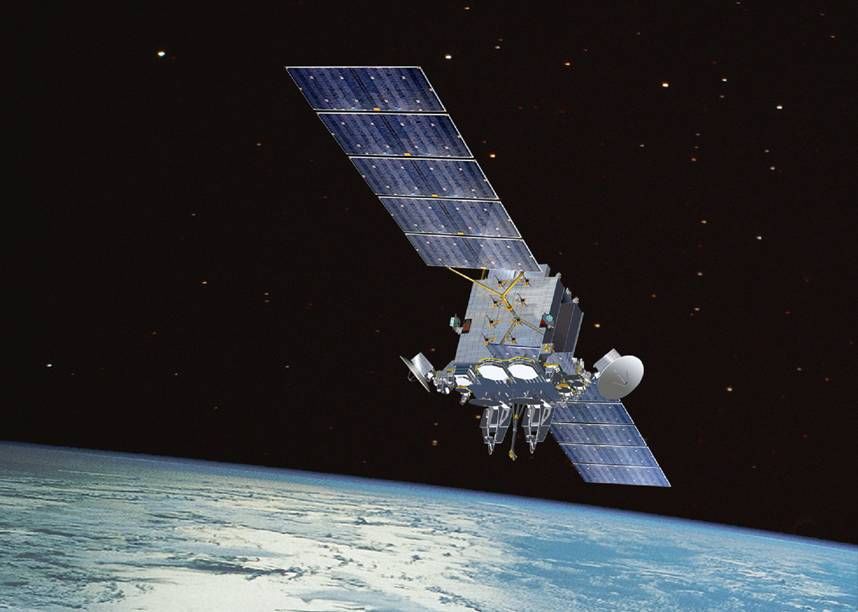
Is UW-Madison involved in hurricane forecasting?

GOES-16 animation of Hurricane Harvey showing Clean Window IR (10.3 µm) and City Lights Background at night, True Color Imagery during the day, 1100-1900 UTC on 25 August 2017 (Photo credit: Space Science and Engineering Center, UW-Madison)

Hurricane Harvey is the first hurricane to make landfall in the United States since Wilma hit Florida in October 2005.

Harvey made landfall early Saturday morning as a Category 4 storm with estimated sustained winds of 130 mph and gusts to 150 mph.

Even in the face of these extreme winds, however, the largest fraction of the widespread damage associated with the storm is likely to be a direct result of the almost unimaginable amounts of rain that will fall with its passage across eastern Texas and Louisiana.

By the time the storm’s weakened remnants are forecast to leave the region on Wednesday, a number of locations are likely to have received more than 2 feet of rain, and some may even see 4 feet!

Needless to say, the ground cannot effectively absorb that much water in so short a time and so widespread flooding will be the rule in southeast Texas.

Millions of people will be adversely affected by this event, and it is only the beginning of what has been predicted to be a fairly vigorous Atlantic hurricane season.

It may surprise you to know that UW-Madison is a major contributor to national efforts to monitor and predict these powerful storms.

The Cooperative Institute for Meteorological Satellite Studies (CIMSS) has a research group within it dedicated to processing satellite remote observations so that they can be used in computer-based forecasts of these storms.

Since hurricanes develop over the vast tropical oceans, these satellite observations are the most comprehensive set of measurements available for these forecast models.

Without this Wisconsin connection, our ability to forecast these mercurial storms would be substantially less successful and many more people would be imperiled by their approach.

Steve Ackerman and Jonathan Martin, professors in the UW-Madison department of atmospheric and oceanic sciences, are guests on WHA radio (970 AM) at 11:45 a.m. the last Monday of each month.

Category: Meteorology, Severe Weather, Tropical

Comments Off on Is UW-Madison involved in hurricane forecasting?

Why is the sky blue?

During a total eclipse, when the full sun is covered by the moon, we only see light on the horizon that is scattered in our direction. (Photo credit: NASA)

All the attention of today’s eclipse has raised interest in the sky’s color.

To understand why the sky is blue, we need to understand a little about light. Light is a form of electromagnetic energy. This form of energy does not need matter to propagate.

We can characterize this energy by its wavelength — the distance along a wave from one crest to another. Our eyes are sensitive to light with wavelengths between approximately 0.4 to 0.7 microns (one micron is a millionth of a meter or one one-hundredth the diameter of a human hair). Blue colors have wavelengths between about .455 and .492 microns, while red colors have longer wavelengths between .622 and .780 microns.

When light beams interact with particles suspended in air, the energy can be scattered or absorbed. Energy that is scattered causes a change in direction of the light path. The amount of light that is being scattered is a function of the size of the particle relative to the wavelength of the light falling on the particle.

Particles that are tiny compared to the wavelength of the light scatter selectively according to wavelength. While all colors are scattered by air molecules, violet and blue are scattered most. The sky looks blue, not violet, because our eyes are more sensitive to blue light (the sun also emits more energy as blue light than as violet).

At sunset and sunrise, the sunlight passes through more atmosphere than during the day when the sun is higher in the sky. More atmosphere means more molecules to scatter the violet and blue light. If the path is long enough all of the blue and violet light gets redirected out of your line of sight, while much of the yellow, orange and red colors continue along the undeviated path between your eye and the sun. This is why sunsets often are composed of yellow, orange and red colors.

During a total eclipse, when the full sun is covered by the moon, we only see light that on the horizon that is scattered in our direction.

Category: Meteorology, Phenomena

Comments Off on Why is the sky blue?

What does the State of the Climate Report tell us?

Sea ice melts on the Franklin Strait along the Northwest Passage in the Canadian Arctic Archipelago on July 22. Because of climate change, more sea ice is being lost each summer than is being replenished in winters. Less sea ice coverage also means that less sunlight will be reflected off the surface of the ocean in a process known as the albedo effect. The oceans will absorb more heat, further fueling global warming. (Photo credit: David Goldman, Associated Press)

The National Oceanic and Atmospheric Administration (NOAA) released its 27th annual State of the Climate report Thursday, and it was full of attention-grabbing news.

Topping the list was the fact that analysis of global temperature measurements revealed that 2016 bumped 2015 as the warmest year in 137 years of record keeping. In fact, 2016 was the third consecutive year of record warmth.

The report found that most indicators continue to portray a warming world. Concentrations of the major greenhouse gases carbon dioxide (CO2), methane (CH4) and nitrous oxide (NO2) rose to record levels in 2016 with CO2 averaging 402.9 ppm (parts per million – or molecules of CO2 per million molecules of atmospheric gas) for the year. This was the first time that the annual average was over 400 ppm — a level that is 33 percent higher than anything the Earth has seen in at least the last half million years.

Among a number of other high-profile measurements, the maximum Arctic sea ice extent (reached near the end of the winter in March 2016) tied the previous year’s record as the smallest in the 37-year satellite record. The minimum sea ice extent, reached at the end of summer in September 2016, tied for second lowest extent ever (with September 2007).

The climate system of Earth has so immense a reservoir of natural variability that three consecutive record-breaking warm years cannot be attributed merely to chance. Instead, these comprehensive measurements constitute a clear signal of ongoing climate change caused or influenced by human activities.

Our nation simply must rise to meet this challenge and must do so without delay.

Category: Climate, Meteorology, Seasons

Comments Off on What does the State of the Climate Report tell us?

Why does the shadow of an eclipse travel west to east?

2016 Total Eclipse seen from Palu, Indonesia.
Credit: Justin Ng

The sun appears to rise in the east and set in the west. This happens because of how the Earth spins as it orbits the sun. If you are in space and look down on the North Pole, the Earth would appear to spin counterclockwise. It is that spin that makes the sun appear on the eastern horizon first and track west.

Viewed from this location in outer space, the moon also appears to move in a counterclockwise motion as it orbits Earth. It is this counterclockwise motion of the moon that causes its shadow during a total solar eclipse to move across Earth’s surface from west to east.

On Aug. 21, all of North America will witness a partial to full solar eclipse. The period of totality — when the moon blocks out most of the sun — will start around 10:15 a.m. Pacific Daylight Time (12:15 p.m. Central) along the northwest coast, occurs about 11:40 a.m. Mountain Daylight Time in central Wyoming and ends on the East Coast around 2:45 p.m. Eastern Daylight Time.

You have probably seen the sun reflected in a lake. This bright reflection is called sun glint. The same principle can be used to track the sun’s progress across the surface of the Earth if you’re in outer space (aboard a satellite, for example). The glint moves from east to west.

If you were on that same satellite during a total solar eclipse, you’d also see the moon’s shadow move across the Earth’s surface, but in the opposite direction.

You can see this phenomenon in a video made from satellite images taken during a total solar eclipse on March 9, 2016 at http://go.madison.com/eclipse-shadow. The video shows both the sun glint and the moon’s shadow as they trek across the western Pacific Ocean.

We will be tracking this month’s eclipse from the weather satellite perspective. You can follow along, and get other information, on our web page at: http://cimss.ssec.wisc.edu/education/eclipse-2017.

Steve Ackerman and Jonathan Martin, professors in the UW-Madison department of atmospheric and oceanic sciences, are guests on WHA radio (970 AM) at 11:45 a.m. the last Monday of each month.

Category: Phenomena

Comments Off on Why does the shadow of an eclipse travel west to east?

Was July a record wet month?

Heavy storms July 10 caused flooding around the Madison area, including partially submerging this soccer goal along Mineral Point Road near West Towne Mall. In total 6.52 inches of rain has fallen in Madison this month, 2.72 inches above normal. (Photo credit: Barry Adams, State Journal archives)

It seems likely that most of us would consider this month of July to be an exceptionally wet one and, in many ways, that is true.

First of all, we have received measurable rain on 11 days this month and a trace of rain on six other days. Thus, well over half of the days this month have involved precipitation.

In total, 6.52 inches of rain has fallen on Madison this month. With no more precipitation today, that would put us 2.72 inches above normal for July. So, it has been a rainy month – but not everywhere in Wisconsin.

For instance, Milwaukee has totaled only 3.69 inches this month, barely (0.35 inches) above its monthly average. Rhinelander has received only 1.62 inches of rain in July, which is a little more than 2 inches below its normal for the month.

As rainy as it has been in Madison, it has been even worse in La Crosse (7.63 inches, which is 3.78 inches above normal for July) and Chicago (7.68 inches, 4.40 inches above normal).

Of course, anyone who has been outside this month will also recognize it has been a mosquito-heavy month. This is directly related to the rainfall as nearly two dozen species of mosquitoes hatch during the summer, in serial fashion, so a prolonged wet summer tends to result in lots of bugs.

It could all be worse, though. In July 1950, Madison received 10.93 inches of rain, which is the record for the month.

That soggy July is not even the wettest month of the year in Madison, as the all-time wettest month here was August 2007 when 15.18 inches of rain fell.

Category: Meteorology, Seasons

Comments Off on Was July a record wet month?