Why was the sky hazy on Thursday and Friday?

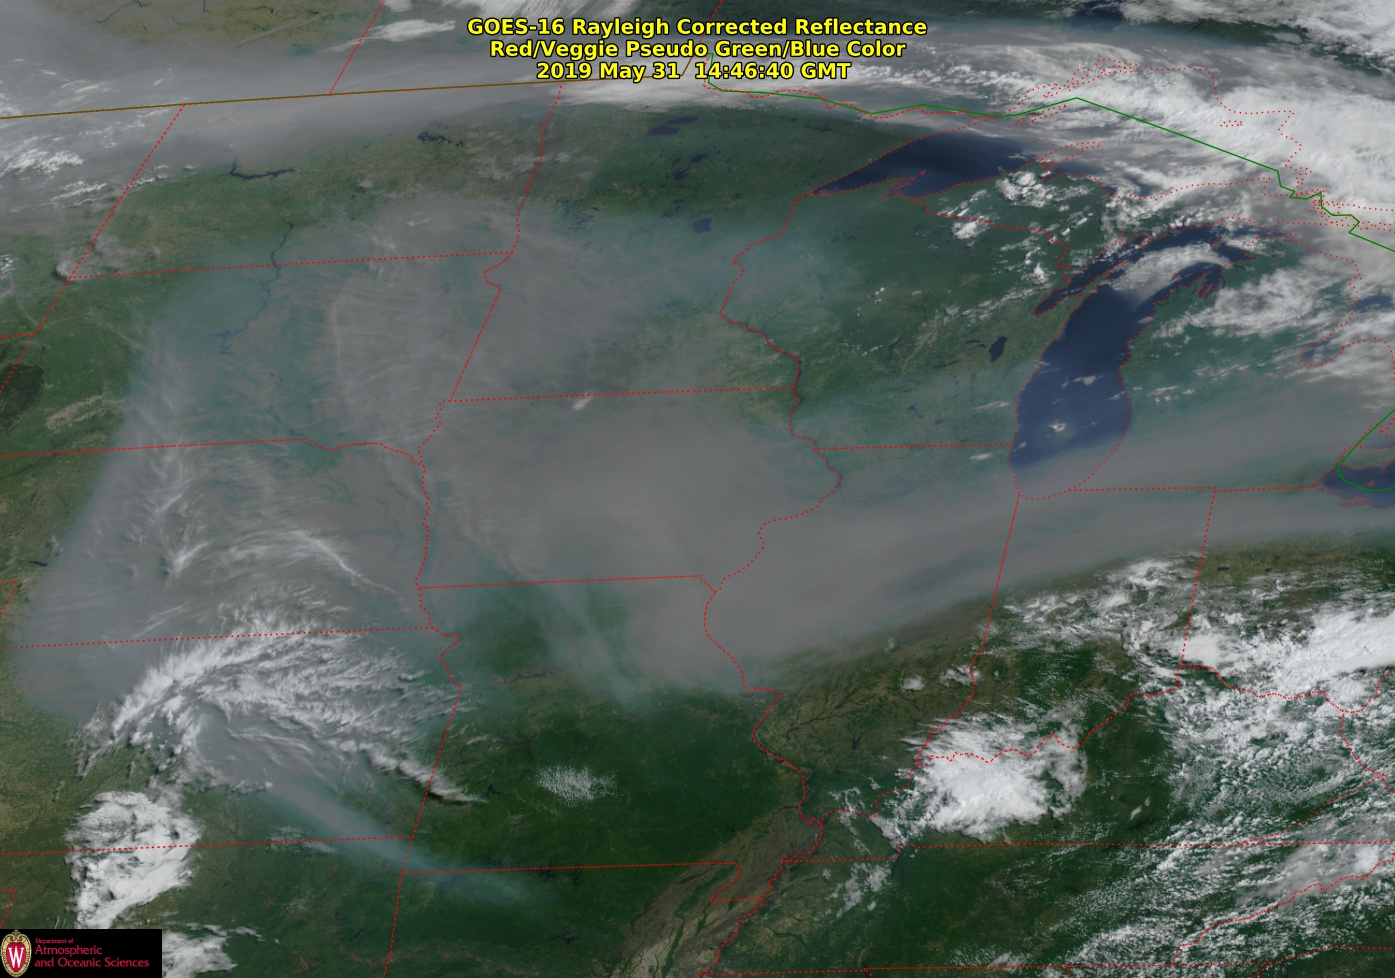
Satellite view of wildfire smoke over the Upper Midwest. Via GOES East (GOES-16)

There have been large forest fires in northern Alberta, Canada, and the smoke has drifted over the Midwest, including Wisconsin.

Smoke can cause the sky to appear hazy, even if the smoke is high above the ground. The smoke scatters sunlight to make the sunlight diffuse and grayish. When the smoke is thick, it can cause brilliant red sunsets and sunrises, as it did on Thursday. When light beams interact with particles suspended in air, the light can be scattered or absorbed.

The amount of light that is being scattered is a function of the number of particles and the size of the particle relative to the wavelength of the light falling on the particle. Small particles, like those of which smoke is composed, scatter violet and blue light more effectively than other colors.

So, as the sun sets and its rays pass through the smoke plume, all the blue light is scattered out of the path between the setting sun and your eyes, leaving just the red and orange colors. This results in the sun having a bright red color when it is low on the horizon. Recently, the smoke above us has been thick enough that the red sun disappeared from view before it set below the horizon.

Winds will sometimes transport the smoke down to the ground, resulting in a reduction in the quality of the air we breath. The small particles that make up the smoke can cause respiratory problems, particularly for children, the elderly and people with asthma.

Smoke doesn’t have much of an effect on our temperature or precipitation. However, official weather reports include observations on sky conditions and visibility.

Category: Phenomena, Weather Dangers

Comments Off on Why was the sky hazy on Thursday and Friday?

Do cell phones network with weather forecasts?

Use of ultrahigh radio frequencies by 5G wireless carriers could interfere with weather predictions. (Image source: SSEC)

Cell phones do not directly interfere with weather forecasts. However, there is concern with how cell phone signals travel through the atmosphere, particularly the 5G network.

The 5G technology is designed to carry more data and make wireless connections faster.

In March, the Federal Communications Commission began auctioning off ultrahigh radio frequencies for use by 5G wireless carriers.

These frequencies are appealing to telecommunication companies because they need to add capacity in urban areas to keep up with increased demand. But these 5G networks have unintended consequences.

Objections are being raised the National Oceanic and Atmospheric Administration and National Aeronautics and Space Administration and other federal agencies. Use of these frequencies for 5G could interfere with weather predictions.

The airwaves being auctioned are near frequencies used by NOAA satellite instruments to observe water vapor, rain and snow. For example, atmospheric water vapor emits a small amount of energy at these ultrahigh radio frequencies. Weather forecasters measure these signals from satellites and use the observations to understand how weather systems are likely to develop.

If networks transmit frequencies where water vapor emits energy, the satellite measurements will not be able to distinguish between those signals generated by the weather systems and the telecommunication signals. Loss of this weather information will impact the accuracy of weather forecasts.

Dr. Neil Jacobs, the acting NOAA administrator who oversees the National Weather Service, told Congress that loss of these weather data could reduce today’s forecast skill to what it was back in 1980.

This could become a global problem if other countries follow the US in using these frequencies for telecommunication. This fall, the World Radiocommunication Conference meets to set global agreements on use of radio frequencies for 5G.

Steve Ackerman and Jonathan Martin, professors in the UW-Madison Department of Atmospheric and Oceanic Sciences, are guests on WHA radio (970 AM) at 11:45 a.m. the last Monday of each month.
Category: Severe Weather, Uncategorized

Comments Off on Do cell phones network with weather forecasts?

What were those flying saucer-shaped clouds?

Thunderstorms rolled through Madison between 8:30 and 9 a.m. Thursday May 16th. Stunning “flying-saucer” clouds accompanied the dark skies of the leading edge of the storm.

These dark, protruding clouds are “shelf clouds.” The clouds look like a shelf and in this case appeared as a stack of shelves. They are one of several distinct visible features of a vigorous thunderstorm complex.

Stunning “shelf clouds” along the northern shore of Madison’s Lake Mendota on May 16.
Credit: Anne Pryor

Air circulates throughout a thunderstorm, some as very turbulent pockets of air. There are also streams of upward and downward moving air. The upward moving air in a thunderstorm is known as the updraft, while downward moving air is called the downdraft.

Air that is cooler than its environment tends to sink as long as it can stay cooler than its surroundings. Sometimes prior to a thunderstorm rain you may feel a blast of cool air. This is the downdraft spreading out as it hits the surface.

The dense, cold air of the downdraft forms the gust front at the surface and flows out ahead of the storm. The gust front can lift the warm, moist air near the ground, forcing it upward to form updrafts in developing thunderstorms.

Clouds are sometimes observed above the gust front. The shelf cloud is one such cloud. It forms as the gust front forces air near the surface to rise.

A shelf cloud looks very ominous but does not produce damaging weather by itself, although it can precede severe weather by a few minutes. This was the situation on Thursday, and the storms produced brief downpours and wind gusts to around 30 mph.

Steve Ackerman and Jonathan Martin, professors in the UW-Madison Department of Atmospheric and Oceanic Sciences, are guests on WHA radio (970 AM) at 11:45 a.m. the last Monday of each month.
Category: Meteorology, Phenomena, Uncategorized

Comments Off on What were those flying saucer-shaped clouds?

What is the Beaufort scale?

Wave watchers check out the ocean action near Peggy’s Cove, Nova Scotia, during Hurricane Bill in August 2009. Based on observations rather than measurements, the Beaufort scale is a method of estimating wind speed based on the general condition of the surface of a large body of water with respect to wind waves and swell. (Photo credit: Associated Press Archives)

The Beaufort scale is a method of estimating wind speed based on the general condition of the surface of a large body of water with respect to wind waves and swell.

It is based on observation of sea state rather than accurate wind measurements. This scale allows sailors to estimate the wind speed just by observing the state of the sea surface.

The scale has a long history, but was finalized in 1805 by Rear Admiral Sir Francis Beaufort, an Irish hydrographer in the British Royal Navy. It was officially first used during the voyage of Charles Darwin on the HMS Beagle (1832-1835).

The Beaufort scale can also be applied to conditions on land, but it is most often associated with the sea state.

The modern-day Beaufort scale consists of 13 numbers ranging from 0 to 12. A zero value on the Beaufort scale is assigned to calm winds and the water surface is smooth.

A Beaufort force 12 occurs with waves greater in height than 46 feet and the sea is completely white with foam and spray with greatly reduced visibility. Such conditions are associated with wind speeds of greater than 74 mph, which are hurricane-force winds.

The National Weather Service defines sustained wind speeds of 39 to 54 mph as a gale, and forecasters typically issue gale warnings when winds of this strength are forecast. A Beaufort force 6 is a near gale with wind speeds between 25 and 30 mph and includes white foam from breaking waves that begins to be blown in streaks along the wind direction.

A Beaufort force in the range of 6 to 7 is designated as strong winds; 8 to 9 as gale-force winds; and 10 to 11 as storm-force winds.

Category: Meteorology, Severe Weather

Comments Off on What is the Beaufort scale?

When did computer-based weather forecasts begin?

NOAA historic weather computer circa 1965, used to process weather data for short and long-range forecasts, analyses, and research. (Photo credit: NOAA’s National Weather Service Collection)

Just over a week past our extraordinary late season snow on April 27, it is worth considering how remarkable it is that such an unusual event can be so well forecasted several days in advance.

The drive to use computer models for weather forecasting had its origins in the immediate aftermath of World War II, initiated at a secret meeting at U.S. Weather Bureau headquarters on the rainy morning of Jan. 6, 1946.

After a series of successes and setbacks that mostly discouraged the broad meteorological community, the first operational computer-generated forecasts were issued on the afternoon of May 6, 1955. Thus, in less than 10 years the notion of a computer-based forecast went from dream to reality.

In the intervening 64 years, the combination of increased theoretical understanding both of meteorology and computational science, increased observational capacity — a good deal of which stems from satellite data — and sheer hard work on the part of a legion of dedicated scientists has resulted in our current forecasting capability.

The fact that our ubiquitous smartphones give everyone access to quite reasonable forecasts several days in advance is the end result of what might be considered the greatest scientific advance of the second half of the 20th century.

It is likely that had our late season snow come in April 1947, or even 1977, we would have been caught unpleasantly by surprise. Luckily, thanks to longstanding commitments to investment in basic scientific research, we are in a much better position today.

So, as you consult your phone for the forecast, remember that the first baby steps in numerical weather prediction were taken 64 years ago this May.

Steve Ackerman and Jonathan Martin, professors in the UW-Madison Department of Atmospheric and Oceanic Sciences, are guests on WHA radio (970 AM) at 11:45 a.m. the last Monday of each month.
Category: Uncategorized

Comments Off on When did computer-based weather forecasts begin?