Did the moon landing influence weather forecasting?

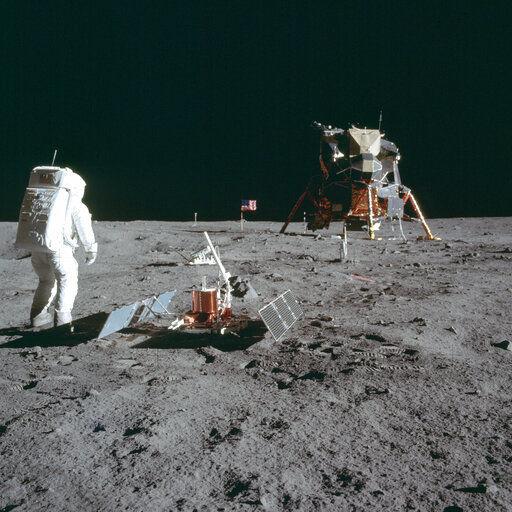
Astronaut Buzz Aldrin Jr. stands next to the Passive Seismic Experiment device on the surface of the moon on July 20, 1969, during the Apollo 11 mission. The space race was responsible for enormous advances in satellite technology. (Photo credit: Neil Armstrong)

On Saturday, we will mark the 50th anniversary of humankind’s first-ever footsteps on a different world, the lunar landing of Apollo 11.

The moon landing represented the peak of the Cold War’s space race and, though motivated by martial competition between geopolitical adversaries, the drive to reach the moon produced a large number of technical advances which most of us take for granted today.

With specific respect to weather forecasting, the space race was responsible for enormous advances in satellite technology that now provide the backbone of the global observations of the atmosphere required to power the weather prediction enterprise.

Another extremely important aspect of the prediction revolution was the rapid development of computer technology. Despite the fact that your mobile phone has more computing power than the entire array of machines available to Mission Control in July 1969, the Apollo program drove the development of smaller and more powerful computers.

Finally, the Apollo program provided inspiration to thousands of young boys and girls who were fortunate enough to see, at an early age, what science really is — a grand adventure of exploration and discovery. One of us (Martin), still retains vivid memories of making the first footprints in the newly fallen snow of a New England blizzard while delivering morning newspapers and imagining himself as Neil Armstrong. That sense of kinship with a hero of exploration likely fueled more than one young person’s desire to pursue the wonders of science.

Category: Climate, Meteorology

Comments Off on Did the moon landing influence weather forecasting?

Can large cities generate their own weather?

The “urban heat island effect” refers to the increased temperatures of urban areas compared with their rural surroundings.

The urban heat island is a well-documented example of inadvertent modification of climate by human activities. It is a classic example of how changing the energy balance of an area can affect the regional climate.

The urban heat island is evident in statistical analysis of surface air temperatures, and was first discovered in the early 1800s in London.

On average, a city is warmer than the countryside because of differences between the energy gains and losses of each region. A number of factors can contribute to the relative warmth of cities, such as heat from industrial activity, the thermal properties of buildings, and the evaporation of water.

Heat produced by heating and cooling city buildings and running planes, trains, buses and automobiles contributes to the warmer city temperatures. Asphalt, brick and concrete retain heat better than do natural surfaces.

Evaporation of water plays a role in defining the magnitude of the urban heat island. Solar energy absorbed near the ground in rural areas evaporates water from the vegetation and soil. Thus, heating in the rural areas is reduced to some degree by evaporative cooling during evapotranspiration.

Megacities tend to have up to 10 percent more cloud cover than surrounding rural areas. (Photo: Pixabay)

A recent study of clouds over London and Paris using satellite data indicates that cities may be generating clouds. During the spring and summer, these megacities are persistently cloudier in the afternoon and evening than nearby rural areas. The authors suggest that the heat retained by buildings drives motions that lead to cloud formation.

Meteorologists have thought that regions downwind of large cities receive more than their expected share of rainfall; however, conclusive evidence has been hard to gather.

Steve Ackerman and Jonathan Martin, professors in the UW-Madison Department of Atmospheric and Oceanic Sciences, are guests on WHA radio (970 AM) at 11:45 a.m. the last Monday of each month.
Category: Meteorology, Phenomena

Comments Off on Can large cities generate their own weather?

What is the hurricane forecast for this year?

An onlooker checks out the heavy surf at the Avalon Fishing Pier in Kill Devil Hills, N.C., as Hurricane Florence approaches the east coast Sept. 13. This year’s official hurricane season runs from June 1 through Nov. 30. (Photo credit: Gerry Broome, Associated Press)

A hurricane is a tropical storm over the Atlantic Ocean basin. The official hurricane season runs from June 1 through Nov. 30.

But that doesn’t mean all hurricanes have to occur during that time period. Indeed, we have already had a hurricane on May 20. That storm is named Andrea. Hurricanes are given names to improve communication between forecasters and the public regarding forecasts.

The National Oceanic and Atmospheric Administration has been making seasonal hurricane forecasts for about the last decade. Their Atlantic Hurricane Season Outlook for this year indicates there is a 70% likelihood of having nine to 15 named storms of which four to eight could become hurricanes, including two to four major hurricanes.

A tropical storm is named if the wind speeds are 39 mph or higher. A hurricane has winds of 74 mph or higher, and a major hurricane has winds of 111 mph or higher. On average, the Atlantic Ocean sees 12 named storms, six hurricanes and three major hurricanes.

So, if the forecast holds up, we are in for a near-normal hurricane season. NOAA’s Climate Prediction Center will update the seasonal outlook in August just prior to the historical peak of the season.

The forecast is based on current and expected conditions. First, an active season would be predicted if the sea surface temperatures are warmer than normal. Warmer temperatures increase evaporation off the sea surface and that provides the energy for the storm.

The forecast is also a function of the El Niño conditions in the Pacific Ocean. We are currently in weak El Niño conditions and, on average, El Niño years are low-hurricane years.

Perhaps surprisingly, the atmospheric pressure pattern over the Arctic also plays a role in the forecast: high pressure means a weaker jet stream, which favors hurricane development.

Category: Uncategorized

Comments Off on What is the hurricane forecast for this year?

Has this been an unusually dreary spring?

From April 1 to June 13, Madison Wisconsin was 0.46 degrees cooler than  normal and accumulated 1.94 inches above normal precipitation, some falling as snow as late as April 27!
(Photo by J. Hart, State Journal archives)

With astronomical summer set to begin on Friday morning at 10:54 a.m. in Wisconsin, it seems like a good time to consider the nature of this seemingly dreary and cold spring that we have just endured.

Almost no one will disagree that this year has had a memorably bad spring, not only locally but around the nation as widespread flooding has put elements of the agricultural sector well behind their normal schedules.

From April 1 to June 13 we have averaged 0.46 degrees below normal in Madison and we have accumulated 1.94 inches above normal of liquid equivalent precipitation, some of it falling as snow as late as April 27.

In the previous four springs we have had similar experiences only once. Some may recall that last April 1 through June 13 we were 0.36 degrees colder than normal and accumulated nearly 7 inches of snow on April 18. In the prior three years during the same period we averaged 1.94, 0.71 and 2.19 degrees above normal. None of these years was notably warm during the period but these recent records do suggest that this year presents a relatively unusual set of circumstances.

In fact, it may be that we have not had such a persistently cool spring since 1997 when April was 3.3 degrees below normal, May was 6 degrees below normal and the first 13 days of June averaged 1.75 degrees below normal, leading to an overall departure of 4.16 degrees below normal for the same period in that year.

So, though we have been waiting for spring to transition to summer, we had it much worse 22 years ago.

Category: Climate, Meteorology, Seasons

Comments Off on Has this been an unusually dreary spring?

Is that photo of circular lightning?

Some see the shape of Wisconsin in this looping lightning bolt that struck near Hager City Wisconsin on May 31. (Credit: Jerry Zimmer)

When we see a flash of lightning, it looks as though it forms all at once.

However, a lightning bolt is actually produced in many steps. The bolt occurs so quickly that it looks like a single brilliant flash, but high-speed photography can reveal several distinct bolts.

Lightning is a huge electrical discharge that results from the rising and sinking air motions that occur in thunderstorms. Lightning can travel from cloud to cloud, within the same cloud, or between the cloud and ground. The lightning in the accompanying photograph appears to be cloud-to-ground lightning.

A typical cloud-to-ground flash begins as negative charges in the cloud that travel toward the ground in a sequence of spurts. These spurts of negative charges are called “leaders.”

Leaders travel a few hundred feet. From the lower end of one leader, another leader forms, and from the lower end of that leader, another. The negative charges hop downward from leader to leader, forming an ionized channel.

Each leader heads in a direction that is independent of the previous ones. Leaders can split, forming tree-like branches resulting in a path that is not a straight line. Most lightning appears jagged because of this, but it also can take a curved path, as in this photograph.

As the negative charges approach the ground, there is an upward stream of positive charges. When the two streams meet, an initial flash occurs in the channel and electricity flows back and forth between the cloud and ground, lighting up the sky.

The ionized channel formed by the leaders is three-dimensional. So, while the bolt in the photograph looks like a 2-D outline of our state, it could be a 3-D spiral that just appears 2-D as we look along its axis. Either way, it is a fantastic and unique photograph.

Category: Meteorology, Phenomena, Severe Weather

Comments Off on Is that photo of circular lightning?