Why does the rate for change of day length vary?

A youngster in a kayak makes a picturesque journey to shore at sunset on Beaver Dam Lake. (Photo credit: Kelly Simon, Beaver Dam
Daily Citizen)

We define the length of the day as the time between sunrise and sunset, so that we can apply some simple mathematics.

Atmospheric conditions can make the actual sunrise and sunset vary slightly from the calculated times. As the Earth moves around the Sun, the length of the day changes.

The length of day at a particular location on Earth is a periodic function of time. This is all caused by the 23.5-degree tilt of the Earth’s axis as it travels around the sun. In the Northern Hemisphere, days are longest at the time of the summer solstice in June, and the shortest days are at the winter solstice in December. At the two equinoxes in March and September, the length of the day is about 12 hours, a mean value for the year.

The length of a day changes far more during the year at higher latitudes than at lower latitudes. At the poles the daytime length varies from 0 to 24 hours, while at the tropics the daytime length varies little.

There is essentially no change in length of day from one day to the next at the time of the solstices. There is more change at the equinoxes. At those times the day-to-day changes can be a few minutes. The day length is changing fastest at the equinoxes.

Consider the percentage change — the change in day length from the previous day divided by the length of day on that day. That can give the impression of how quickly we lose daylight.

The shortening of the length of day in terms of percentage change is at its peak in late October and early November around our latitude.

Category: Meteorology, Seasons

Comments Off on Why does the rate for change of day length vary?

Why should we be concerned about the Arctic climate?

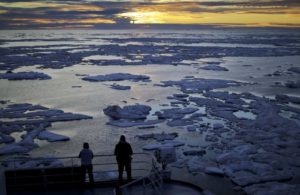
Researchers look out from the Finnish icebreaker MSV Nordica as the sun sets over sea ice in the Victoria Strait along the Northwest Passage in the Canadian Arctic Archipelago. The occasional extreme late-summer storm can be quite damaging to the ice. (Photo credit: David Goldman, Associated Press)

Changes in the Arctic have global implications. The global average temperature is warming but the air temperatures in the Arctic are increasing twice as fast or possibly faster.

The year 2019 will go down as the second-lowest minimum extent of sea ice. Sea ice is bright and reflects about 80% of the sunlight that falls on it, helping to keep the surface cold.

When the sea ice melts, the ocean surface is exposed and absorbs incident solar energy. That leads to a warming of the water and the air above, which melts more ice, leading to increased warming and more melting.

Arctic sea ice is now less than half as thick as it was at this time of year in 1980.

The Arctic permafrost is thawing, releasing carbon and methane that has been frozen in the earth for millennia. Release of these two greenhouse gases into the atmosphere causes further warming. The ground can collapse when permafrost laced with ice melts, weakening structures built on the surface.

Global wind patterns are driven by the temperature difference between the equator and the polar regions.

The quicker warming of the Arctic reduces this temperature difference, which can change global wind patterns.

The melting of ice over Greenland reached historically high levels in 2019 when wind patterns transported warm air from Europe’s midsummer heat wave. The rapid melting removed the previous winter’s low snowfall and exposed older ice. The older ice is not as bright as the fresh snow and increases absorption of solar energy thereby increasing the melting.

The Greenland ice sheet is the world’s second-largest repository of freshwater. As the ice melts, it enters the oceans and can raise global sea levels. Current trends are heading to sea level rise of 6 to 12 inches worldwide this century.

Indigenous populations are also affected. The reduction of frozen areas affects the cultural practices of the Arctic peoples developed through their centuries-old finely honed relationship with the land, ocean and ecosystems.

Category: Climate, Meteorology

Comments Off on Why should we be concerned about the Arctic climate?

What is the status of the ozone hole?

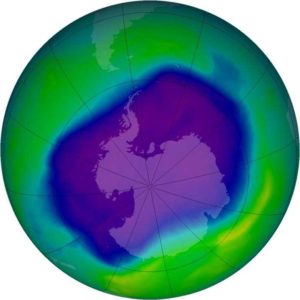
The ozone hole is a region where there is severe depletion of the layer of ozone — a form of oxygen — in the upper atmosphere that protects life on Earth by blocking the sun’s ultraviolet rays. (Image credit: NASA)

Ozone occurs about 18 miles above the Earth’s surface and is both caused by and provides protection from damaging ultraviolet energy emitted by the sun.

The development of an atmospheric “ozone layer” allowed life to move out of the oceans and onto land.

The ozone hole occurs high over the continent of Antarctica. It is the appearance of very low values of ozone in the stratosphere.

The winter atmosphere above Antarctica is very cold. The cold temperatures result in a temperature gradient between the South Pole and the Southern Hemisphere middle latitudes, causing strong westerly stratospheric winds that encircle the South Pole region.

The strong winds, called the Polar Vortex, prevent warm air from the equator from reaching polar latitudes. The extremely cold temperatures inside the strong winds help to form clouds called polar stratospheric clouds, or PSCs.

PSCs begin to form during June, which is wintertime at the South Pole. Chemicals on the surface of the particles composing PSCs result in chemical reactions that remove the chlorine from the atmospheric compounds.

When the sun returns to the Antarctic stratosphere in the spring (our fall), sunlight splits the chlorine molecules into highly reactive chlorine atoms that rapidly deplete ozone. The depletion is so rapid that it has been termed a “hole in the ozone layer.”

The amount of ozone in the atmosphere is routinely measured from satellites. Typically, the Antarctic ozone hole has its largest area in early September and lowest values in late September to early October.

This year’s data reveal that the formation of the ozone hole came about two weeks early and is much smaller than in recent decades. This year, the polar vortex is unstable because the stratosphere has reached temperatures of up to 40 degrees above normal, preventing the formation of PSCs.

The global ban on chlorofluorocarbon, known commonly as the refrigerant Freon, will eventually lead to the removal of chlorine compounds from the stratosphere during the 21st century. In the absence of CFCs, the ozone layer will repair itself naturally.

The good news is that the size of the ozone hole is showing signs of shrinking.

Category: Meteorology, Seasons

Comments Off on What is the status of the ozone hole?

When is the autumnal equinox?

The harvest moon, shown in 2015, isn’t defined by any change in its color, but rather by the time of year it arrives — closest to the autumnal equinox. This year’s autumnal equinox occurred this morning. (Photo credit: John Hart, State Journal)

This morning we officially entered fall as the autumnal equinox occurred at 2:50 a.m.

That means that today, in common with every location on Earth, we will enjoy exactly 12 hours of daylight and 12 hours of night.

Of course, 12 hours of daylight in Madison (43 degrees north latitude) is substantially different than 12 hours of daylight at the North Pole (90 degrees north latitude) where the Sun will barely be visible above the horizon for the 12 hours of “daylight.”

On Tuesday, the sun will not appear above the horizon at the Pole and will not come back for six months.

As the days march on, the same fate will gradually overtake other latitudes in the Northern Hemisphere until by Dec. 21, the sun will not rise even at 66.5 degrees north latitude.

The primary means by which air is warmed is by its contact with the surface of the Earth that, when the sun shines, can absorb radiation and heat up.

A leading consequence of the shortening days, especially at high latitudes, is that air masses can begin to get really cold again. Even as we enjoy a rather warm September, the areal extent of the cold wintertime air is growing at high latitudes.

As it encroaches southward from the Pole, the polar jet stream, always on the warm edge of the coldest arctic air, begins to take up residence at lower latitudes bringing with it the powerful storms of late autumn and winter.

So, enjoy the beautiful early fall days we are likely to have this week in Madison because the cosmic deck is stacked against us!

Category: Meteorology, Seasons

Comments Off on When is the autumnal equinox?

What is the hurricane cone of uncertainty?

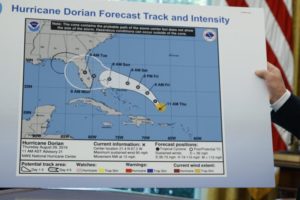
A hurricane map’s cone of uncertainty is developed from computer forecast models by the National Hurricane Center and shows the most likely path of a hurricane’s eye. President Donald Trump stirred controversy when he claimed that Hurricane Dorian could possibly threaten Alabama. (Photo credit: Evan Vucci, Associated Press)

Starting in the 1950s and up until the 1980s, meteorologists forecast the path of hurricanes using statistical prediction based on past data and current climatological data.

Today, weather computer models are primarily used for the forecasting.

The National Hurricane Center (NHC) issues 120-hour, 96-hour, 72-hour, 48-hour, 24-hour and 12-hour forecasts. The NHC forecasts include the hurricane track, intensity, size, along with rainfall and storm surge.

Once a hurricane has formed, scientists track the storm and predict its path using three- to five-day forecasts. Different models are used to predict the path of the hurricane. More than one model is used, as well as multiple forecasts from the same model with slightly different conditions.

The various hurricane forecast models create objective, computer-simulated predictions of a hurricane’s path and intensity. Each of these models will predict slightly different storm tracks.

The cone of uncertainty represents the probable track of the center of the hurricane, based on the models used to make the forecast. The cone represents the uncertainty in the forecast of the storm’s center, not necessarily the areas that will experience impacts.

The NHC produces many different graphic products and text messages each day. The graphics, including the cone of uncertainty, is used to communicate the model output to the public.

The cone of uncertainty should be used to get a rough idea of where the storm center may go, and the current wind watches and warnings for coastal areas.

The hurricane forecast models have improved, and continued improvements are expected. The track of the hurricane is better predicted than its intensity. Predicting the intensity accurately remains an outstanding challenge of meteorology.

Steve Ackerman and Jonathan Martin, professors in the UW-Madison Department of Atmospheric and Oceanic Sciences, are guests on WHA radio (970 AM) at 11:45 a.m. the last Monday of each month.
Category: Meteorology, Severe Weather, Tropical

Comments Off on What is the hurricane cone of uncertainty?