When did computer-based weather forecasts begin?

Numerous computers and monitors enable National Weather Service operations.
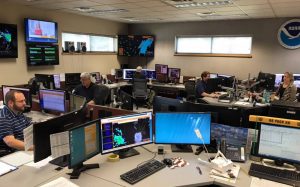
(Photo Credit: NWS Green Bay)

Immediately after World War II, it became fashionable to imagine technologies that might allow human beings to control the weather. In fact, one goal advocated by influential scientists was actually to explode nuclear bombs in the right locations and in the right quantity to alter the weather in favorable ways.

Such an enterprise would require accurate forecasts of the weather thought possible by using brand new computer technology to make the millions of requisite calculations.

The drive to use computer models for weather forecasting was initiated at a secret meeting at U.S. Weather Bureau headquarters on the rainy morning of Jan. 6, 1946. After a series of successes and setbacks that mostly discouraged the broad meteorological community, the first operational computer-generated forecasts were issued on the afternoon of May 6, 1955. Thus, in less than 10 years the notion of computer-based forecasting went from dream to reality.

In the intervening 65 years, the combination of increased theoretical understanding both of meteorology and computational science, increased observational capacity (a good deal of which stems from satellite data), and sheer hard work on the part of a legion of dedicated scientists has resulted in our current forecasting capability.

The fact that our ubiquitous smart phones give everyone access to quite reasonable forecasts several days in advance is the end result of a what might be considered the greatest scientific advance of the second-half of the 20th century. So, as you consult your phone for the forecast, remember that one of the first baby steps in numerical weather prediction was taken 65 years ago Wednesday.

Category: Meteorology

Comments Off on When did computer-based weather forecasts begin?

Is COVID-19 leading to cleaner air?

Many states have implemented lockdowns and shelter-in-place or “safer at home” orders to help contain the spread of the disease caused by the new coronavirus.

In these challenging times, our local businesses need your support. Find out how to get food, goods, services and more from those remaining open.

This response to the COVID-19 pandemic has reduced traffic and reduced production by industrial plants. This response has improved the quality of the air we breathe.

Atmospheric nitrogen dioxide is a by-product of burning fossil fuels for transportation and electricity generation. Nitrogen dioxide, or NO2, is also a harmful substance and is an indicator of air quality.

NASA manages instruments on satellites that can monitor global pollution. One of those instruments is the Ozone Monitoring Instrument (OMI). In addition to monitoring global ozone, OMI also makes measurements of the atmospheric concentration of NO2.

NASA N02 Data comparing March 2020 air quality to the 2015-2019 average.

The OMI measurements show less air pollution over the northeast United States in March 2020, when compared with the average values for the month of March between 2015 and 2019. The nitrogen dioxide levels are down about 30% over major metropolitan areas, including Washington, D.C., New York City, Philadelphia and Boston.

The European Space Agency (ESA) also manages satellites that observe and track air pollution. Those satellites also observed a sharp decrease in nitrogen dioxide over Italy after stay-at-home orders.

The reduced emissions suggest that people are taking steps to reduce their exposure by staying home. Measurements from satellites showed decreasing concentrations of NO2 over China in late January, coinciding with its nationwide quarantine.

Steve Ackerman and Jonathan Martin, professors in the UW-Madison department of atmospheric and oceanic sciences, are guests on WHA radio (970 AM) at 11:45 a.m. the last Monday of each month. Tune in at https://wxguys.ssec.wisc.edu/listen2/

Category: Uncategorized

Comments Off on Is COVID-19 leading to cleaner air?

How strong a wind will knock someone over?

Ning Gao, left, and Xiaoying Li contend with blustery conditions while visiting James Madison Park to view Lake Mendota’s wind-riled waves. (Photo credit: John Hart, State Journal archives)

We have had some hefty winds this past week.

The wind can displace objects, including people.

Wind is air moving from areas of high atmospheric pressure to low pressure. Violent destructive winds, as well as gentle summer breezes, result from a complex interplay of different forces.

One of these forces results from a pressure gradient, or how fast pressure changes over distance. When pressure changes rapidly over a small distance, the pressure gradient force is large. Strong winds almost always result from large pressure gradients.

The greater the difference in pressure over a specific distance, the faster the air flows. Strong winds can also flow out from thunderstorms.

Since wind is air in motion, it has momentum. This momentum is transferred to the object the wind hits. Thus, the force of the wind can push objects by moving them or even knocking them over. Winds moving over and around objects can cause pressure changes around the object, which can also cause it to move.

What wind speed would knock you over?

You can derive a mathematical equation to answer that. It would depend on several factors: the velocity of wind (actually the square of the velocity); gravity; static friction (the force that keeps you anchored to the ground, along with gravity); drag of the wind pushing on you; the air density; your weight, size and center of gravity.

If you weighed 100 pounds, it would take a wind speed of about 45 mph to move you, but not knock you down, unless you lose your balance. Knocking you down would take a wind of at least 70 mph. The terminal velocity, which is the wind speed (falling speed) where the force of the wind equals the force of gravity, for a person is about 120 mph — that would likely knock you down.

Category: Meteorology, Severe Weather

Comments Off on How strong a wind will knock someone over?

What was that stuff that fell on Thursday?

On Thursday, many locations in southern Wisconsin experience snow squalls in which the falling precipitation was momentarily quite intense.

This event was an example of shallow convection – as opposed to the deep convection of summertime thunderstorms. Thursday’s shallow convection was spawned by a conspiracy of circumstances occurring at different levels in the atmosphere.

Near the surface, the early morning sunshine led to an increase in the near surface air temperature while at about 3 miles above the ground the air was cooling rapidly as colder air moved southward over the region. Warming the surface and cooling the air at upper levels reduces the stability and encourages vigorous upward vertical motion and cloud production.

What fell out of the sky was varied depending on your location, but many places saw snow grains, snow pellets or graupel. These particles are frozen hydrometeors that maintain their original crystalline structure.

Graupel observed in Michigan on April 9th, 2020. Credit: Diana Johns

When a pre-existing piece of non-crystalline ice falls below the level at which the temperature is at or below the 32-degree freezing level, the particle accretes liquid water. When the particle is subsequently forced above the freezing level, that liquid coating freezes. A hailstone is produced when this process occurs several times before the particle is massive enough to fall to the ground.

Steve Ackerman and Jonathan Martin, professors in the UW-Madison department of Atmospheric and Oceanic Sciences, are guests on WHA radio (970 AM) at 11:45 a.m. the last Monday of each month.

Category: Meteorology, Phenomena

Comments Off on What was that stuff that fell on Thursday?

Is the reduction in air traffic affecting the weather?

The COVID-19 pandemic has caused a reduction in air traffic. This reduction has had at least two impacts so far, one relating to the exhaust from aircraft engines and the other to weather forecasts.

Exhaust from aircraft engines can be seen sometimes as condensation trails, or contrails. The exhaust of an aircraft contains both gas and tiny particles called aerosols. Both of these are important in the formation of contrails. Contrails form when water vapor condenses and freezes around the small particles that exist in aircraft exhaust.

The balance between Earth’s incoming sunlight and outgoing heat drives climate change. Contrails trap energy coming off the earth and atmosphere below that would otherwise find its way to space. Persisting contrails can spread into extensive cirrus clouds that tend to warm Earth, because they reflect less sunlight than the amount of heat they trap.

In addition to transporting people, airlines make measurements of the environment as they fly, including observations of temperature, wind speed and wind direction. Meteorologists incorporate these observations into weather forecast models as initial conditions. Of particular importance are the observations of the wind.

The National Weather Service uses approximately 250 million of these measurements every year. The data provided by U.S. airlines dropped by half at the end of March. There have been studies of how these observations impact a weather forecast, with some demonstrating that aircraft reports are second only to satellite data in their impact on forecasts.

The recent reductions caused by the pandemic have impacted the forecasting of how weather systems move around the globe. A study by the European Centre for Medium-Range Weather Forecasts concluded that removing all aircraft data from weather models reduces accuracy by 15%.

Steve Ackerman and Jonathan Martin, professors in the UW-Madison department of Atmospheric and Oceanic Sciences, are guests on WHA radio (970 AM) at 11:45 a.m. the last Monday of each month.

Category: Climate, Phenomena

Comments Off on Is the reduction in air traffic affecting the weather?