As we all work to recover from our recent cold spell, the natural question is: Are we done with bitter cold for the winter?
If we use an overnight low temperature at or below zero as the definition of a cold spell, then 41 of the 81 winters since 1939-40 have seen a cold spell after Feb. 22 — that’s 50.6% of the time. In fact, in 1982 the last zero-degree or colder night was not until April 2, the latest date in the last 81 years.
None of this bodes well for our chances this year. It should be noted, however, that in the last 20 years, the latest cold spell occurred March 10, in 2003.
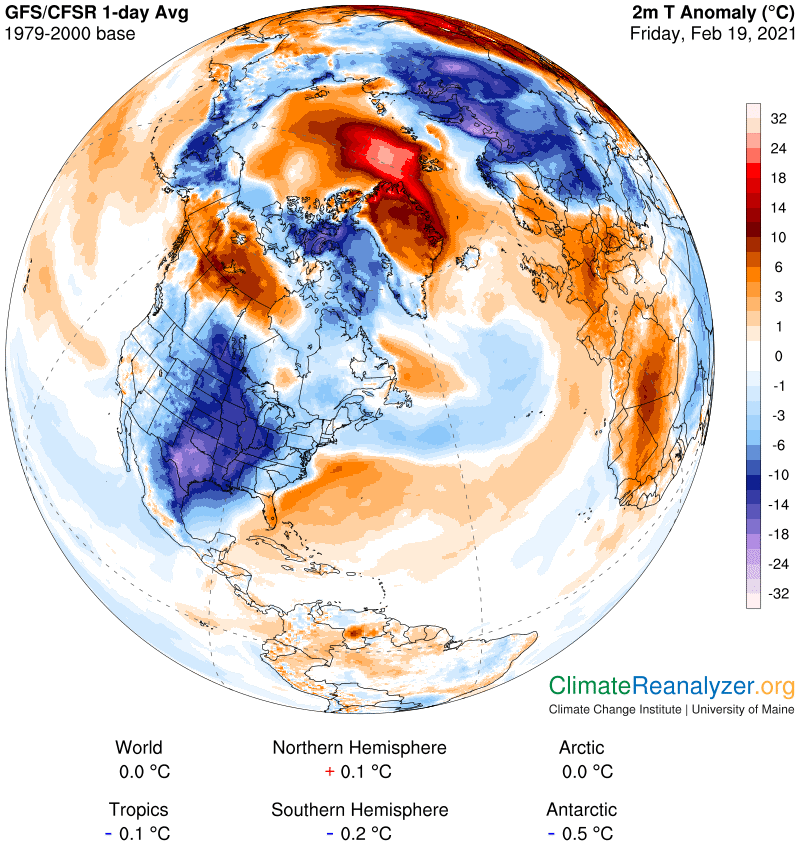
Recent research at UW-Madison has documented a systematic warming of the lower troposphere during Northern Hemisphere winter over the past 71 seasons. Elements of that analysis have suggested that the hemisphere begins its warm up much earlier than the spring equinox, which occurs around March 22. In fact, the hemispheric warm up really accelerates in the first few days of March.
Though it is true that this hemispheric signal does not always translate to a similar warm up at any given location, it is comforting to know that the entire hemisphere is trying to shake off winter as early as the next couple of weeks. So whether or not we have just had our last below-zero night of the season, we really do not have that much farther to go.