Did weather forecasting play a role in D-Day?

American assault troops move onto a beachhead code-named Omaha Beach, on the northern coast of France, on June 6, 1944, during the Allied invasion of the Normandy coast. The success of the invasion was extraordinarily dependent on weather conditions. (Photo credit: Associated Press)

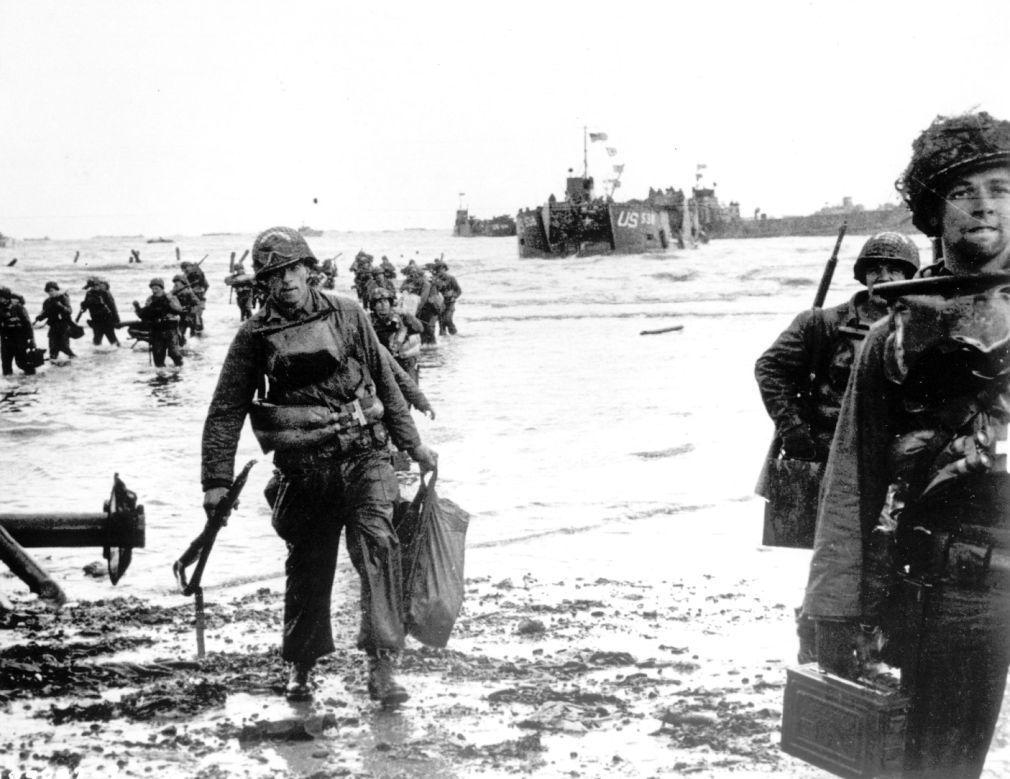
Last week was the 78th anniversary of the Allied invasion of Europe that began with the landings on the beaches at Normandy. The combined land, air and sea assault of June 6, 1944, remains the largest such event in history.

The success of the invasion was extraordinarily dependent on weather conditions. More than three months before the invasion, a combined British and American forecasting team began rigorous forecast exercises designed to iron out the physical and logistical kinks of such a coordinated effort.

As June drew near, the nature of this collaboration was still problematic as the two groups employed vastly different methods in fashioning the requisite three- to five-day forecasts. The British were attempting to make such forecasts based upon the understanding of atmospheric dynamics that had grown substantially during the war. The Americans were employing a method based on a statistically based search through old weather data for historical analogues that could be used to guide the forecast.

To maintain secrecy, a large portion of the Allied fleet was squirreled far away in northern Scotland. Consequently, five days of lead time was required to mobilize these forces. Thus, Gen. Dwight D. Eisenhower needed to know by May 31 whether the first week of June, the prospective target for the invasion, would provide favorable weather.

The forecasters foresaw a break in that year’s unusually stormy late spring and suggested June 5 would work. As the day approached, the team realized that a one-day postponement would offer better conditions, prompting Eisenhower to make the fateful decision to invade on June 6, under barely acceptable conditions.

Had the Allies delayed, the combination of lunar cycle, tides and weather almost certainly would have postponed the invasion for more than a month, likely costing the effort the tremendous advantage of secrecy.

Steve Ackerman and Jonathan Martin, professors in the UW-Madison department of atmospheric and oceanic sciences, are guests on WHA radio (970 AM) at 11:45 a.m. the last Monday of each month. Send them your questions at stevea@ssec.wisc.edu or jemarti1@wisc.edu.

Category: History, Meteorology

Comments Off on Did weather forecasting play a role in D-Day?

How can you report tornadoes?

National Weather Service’s Skywarn logo
(Image credit: weather.gov)

The National Weather Service is always looking for trained volunteers to provide severe weather reports, including reports of tornadoes.

Its spotter training sessions are free and last between 90 minutes and two hours. Trained volunteers receive certificates and are added to the National Oceanic Atmospheric Administration, or NOAA, database of weather spotters. They also receive a Spotter ID. A virtual training option is also available.

The spotter program is informal and voluntary. Observations can be made as spotters carry out their daily routines.

The training covers the basics of thunderstorm development and fundamental storm structure. Spotters learn to identify potential severe weather features and how to report the information. Basic severe weather safety is also covered.

SKYWARN is a NWS volunteer program with more than 350,000 trained severe weather spotters. Volunteer spotters relay their severe weather reports to the weather service as they observe them. Their observations are used by forecasters to track storms and alert the public to dangerous weather situations.

NOAA is also seeking volunteers to help collect additional data about people’s severe weather experiences. Their new Tornado Tales citizen science tool is an online survey in which participants submit anonymous reports of their tornado experiences. The information will be used by NOAA’s National Severe Storms Laboratory (NSSL) to better understand how people receive, interpret and respond to tornado information from NOAA.

NOAA collects a lot of science data about storms from satellites, radars and weather stations. It has less data about what people do when tornadoes strike, or are about to strike. Tornado Tales — go.madison.com/TalesTornado — gathers information about what people affected by severe weather are really doing. Hopefully, this will generate understandings that NOAA social scientists can use to refine messaging about tornado warnings and watches.

Steve Ackerman and Jonathan Martin, professors in the UW-Madison department of atmospheric and oceanic sciences, are guests on WHA radio (970 AM) at 11:45 a.m. the last Monday of each month. Send them your questions at stevea@ssec.wisc.edu or jemarti1@wisc.edu.

Category: Meteorology, Severe Weather, Weather Dangers

Comments Off on How can you report tornadoes?

What does the hurricane season look like?

The official Atlantic basin hurricane season runs from June 1 through Nov. 30, with an average of 10 to 15 storms each year.

2022 Atlantic Basin Hurricane Season Infographic. (Credit: NOAA)

The peak of activity in the Atlantic basic runs from mid-August to mid-October. During that subset of the entire season, more than 70% of all storms in the last 100 years have occurred.

The National Oceanic and Atmospheric Administration, or NOAA, predicts that there is a 70% chance that this year’s Atlantic hurricane season will include 14 to 21 named storms, or storms with winds of 39 mph or higher. Of those, NOAA predicts that six to 10 hurricanes will have winds of 74 mph or greater, and three to six major hurricanes will have winds of 111 mph. This could be the seventh year in a row that the hurricane season is more active than usual.

Hurricanes are given people’s names because it is easy to identify one storm from another and the names are easy to remember. When a tropical storm reaches wind speeds of 39 mph, the storm is then called Tropical Storm “Blank,” the blank being whatever name is next on the alphabetical list. A tropical storm is classified as a hurricane when it reaches wind speeds of 74 mph. If the storm turns into a hurricane, it keeps its original name and is referred to as Hurricane “Blank.”

The first storm of the 2022 year will be named Alex, and the next four will be named Bonnie, Colin, Danielle, and Earl, according to the National Hurricane Center.

The Saffir–Simpson scale rates hurricanes on a scale of 1 to 5 based on the damage their winds would cause upon landfall. Major hurricanes are those classified as Category 3 and higher on this scale. Category 3 hurricanes have a one-minute sustained wind between 111 mph and 130 mph. The one-minute sustained winds in a Category 5 hurricane are greater than 155 mph.

Steve Ackerman and Jonathan Martin, professors in the UW-Madison department of atmospheric and oceanic sciences, are guests on WHA radio (970 AM) at 11:45 a.m. the last Monday of each month. Send them your questions at stevea@ssec.wisc.edu or jemarti1@wisc.edu.

Category: Climate, Severe Weather, Tropical

Comments Off on What does the hurricane season look like?

Is 2022 an active tornado season for the U.S?

Tornadoes can occur anytime of the year, so it is too early to answer this question.

Tornado damage in the town of Dunkirk near Stoughton Wisconsin from March 2022.
(Photo credit: State Journal archives)

Tornado season is based on when the ingredients for severe weather come together in a particular region. Because a change in wind with height is closely related to the presence of a jet stream, tornado season moves north and south during the year with a jet stream.

Tornado season peaks in March and April in the Southeast but not until July in the upper Midwest and Northeast. The deep South has a secondary peak in tornado occurrence in November.

Tornadoes happen at any time of day or night. However, they thrive on solar heating and in some cases the ability of warm, moist air at the surface to penetrate a low-level capping inversion. Therefore, the most likely times for tornadoes are late afternoon or early evening. More than half of all U.S. tornadoes occur during the hours of 3 p.m. to 7 p.m. local time.

As of Friday, there have been 573 confirmed tornadoes in the U.S., causing 15 fatalities. The number of tornadoes puts this year at the 75th percentile climatologically.

The ongoing La Niña is predicted to continue through spring and possibly summer. La Niña conditions favor a more active severe thunderstorm and tornado season in the US.

Tornadoes are classified based on the damage the tornado does, which enables us to estimate the wind speed of its rotating winds. All tornadoes are assigned a single number from the Enhanced Fujita scale, abbreviated EF, according to the most intense damage caused by the storm. The weakest tornado is EF0, with winds less than 85 mph. The strongest is EF5, where the winds are greater than 200 mph. As of Friday, there have been no EF5 tornados, 15 EF3 and 2 EF4 tornados.

Steve Ackerman and Jonathan Martin, professors in the UW-Madison department of atmospheric and oceanic sciences, are guests on WHA radio (970 AM) at 11:45 a.m. the last Monday of each month. Send them your questions at stevea@ssec.wisc.edu or jemarti1@wisc.edu.

Category: Climate, Meteorology, Severe Weather

Comments Off on Is 2022 an active tornado season for the U.S?

How does the recent humidity stack up against prior Mays?

The dramatic shift in our weather that took place over the last week will likely be memorable for a number of reasons.

First, on Tuesday Madison reached 90 degrees for the first time this year, the fourth earliest first 90-degree day in Madison’s history.

The all-time earliest was on April 22, 1980, when the temperature reached 94. The other two earlier first 90-degree days were April 28, 1952 (90, followed by 90 on April 30 — making April 1952 the only one in at least the last 80-plus years in Madison with two 90-degree days) and May 5, 1949 (90).

As if that were not enough, we also became the second May ever with four days at or above 90 — the first time was May 26-29, 2018.

Tropical moisture on May 13th tracked by satellites. (Image credit: CIMSS Total Precipitable Water)

Along with such unusually warm temperatures, we also experienced extraordinary humidity with this episode. Along with a high temperature of 91 on Wednesday , the dew point soared to 73 degrees at the airport — and 79 degrees on the roof of our building on campus. Dewpoint is one of several measures of the water vapor content of the air — it measures the temperature to which air must be cooled (at constant pressure) to reach 100% relative humidity. The higher the dewpoint, the greater the water vapor content of the air.

This dramatic moisture surge set the stage for a low temperature of 73 degrees on Thursday — the highest Madison daytime minimum in May since May 29, 1874. At the time of that recording, the official measurement spot for Madison was Bascom Hall. In fact, that observing site was in use on the only other such instances as well — the record 74 degrees on May 28, 1871 (followed by 73 degrees on the 29th and again on the 31st).

The fact that the recent extreme humidity values were recorded more than two weeks before any other such events in Madison history — and as the regional leaf-out began — testifies to the purely tropical nature of the air.

Steve Ackerman and Jonathan Martin, professors in the UW-Madison department of atmospheric and oceanic sciences, are guests on WHA radio (970 AM) at 11:45 a.m. the last Monday of each month. Send them your questions at stevea@ssec.wisc.edu or jemarti1@wisc.edu.

Category: History, Meteorology, Seasons

Comments Off on How does the recent humidity stack up against prior Mays?