Was April colder and gloomier than normal this year?

The recent month of April here in Madison was noteworthy on a number of levels.

First of all, we had snow on seven different days during the month, not quite the record of 13 from April 1950, but substantially above the average of about four days over the last 70-plus years.

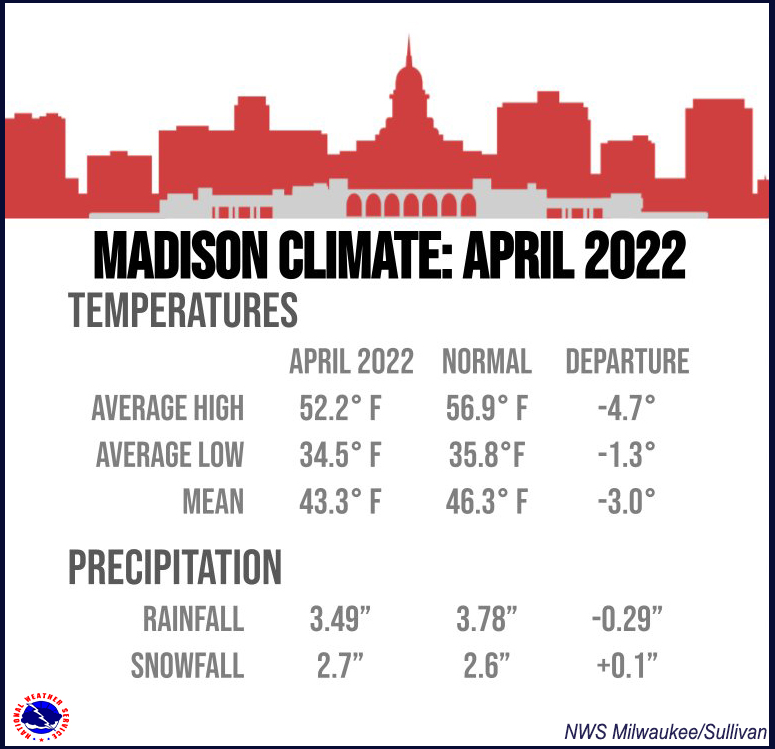
Additionally, the month’s average temperature was 2.9 degrees below average — not a result of any particularly bitter days but a seemingly unending succession of cloudy and cool days. It is important to note that this daily average departure from normal of 2.9 degrees was the result of daytime highs being 4.7 degrees colder than normal and overnight lows being only 1.3 degrees below normal.

The cloudiness aspect of the past month’s weather can be directly assessed in comparison to recent Aprils through use of a heliometer, a device that measures the amount of solar radiation incident on the surface in units of watts per square meter.

Courtesy of calculations done by our colleague and department chair, professor Ankur Desai, it turns out that this past April was the “dimmest” April since in the last decade, registering an average of 287.28 watts per square meter (W/m2) during the daytime hours. Its nearest competitor for this unflattering distinction was April 2019, when the monthly daytime average was just 296.62 W/m2. The “brightest” April in the last decade occurred in 2015, when the daily average insolation was 377.82 W/m2.

So, if the past month seemed gloomy to you, you were absolutely correct in that assessment. It appears as though the coming week’s warmth and humidity will make us quickly forget that we had a protracted end to winter this year.

Steve Ackerman and Jonathan Martin, professors in the UW-Madison department of atmospheric and oceanic sciences, are guests on WHA radio (970 AM) at 11:45 a.m. the last Monday of each month. Send them your questions at stevea@ssec.wisc.edu or jemarti1@wisc.edu.

Category: Climate, Meteorology, Seasons

Comments Off on Was April colder and gloomier than normal this year?

Why is May 6 such a special day in weather science history?

Immediately after World War II, it became fashionable to imagine technologies that might allow human beings to control the weather.

In fact, one goal advanced by influential scientists was actually to explode nuclear bombs in the right locations and in the right quantity so as to alter the weather in favorable ways. Such an enterprise would require accurate forecasts of the weather thought possible by using the brand new computer technology to make the millions of requisite calculations.

Modern smartphones deliver weather forecast first generated by computers on May 6, 1955.

The drive to use computer models for weather forecasting was initiated at a secret meeting at the U.S. Weather Bureau headquarters in Washington, D.C., on the rainy morning of Jan. 6, 1946. After a series of successes and setbacks that mostly discouraged the broad meteorological community, the first operational computer-generated forecasts were issued on the afternoon of May 6, 1955.

Thus, in less than 10 years the notion of computer-based forecasts went from dream to reality. In the intervening 67 years, the combination of increased theoretical understanding both of meteorology and computational science, increased observational capacity (a good deal of which stems from satellite data), and sheer hard work on the part of a legion of dedicated scientists has resulted in our current forecasting capability.

The fact that our ubiquitous smart phones give everyone access to quite reasonable forecasts several days in advance is the end result of what might be considered the greatest scientific advance of the second half of the 20th century. So, as you consult your phone for the forecast, remember that one of the first baby steps in the march toward the modern miracle of numerical weather prediction were taken 67 years ago Friday.

Steve Ackerman and Jonathan Martin, professors in the UW-Madison department of atmospheric and oceanic sciences, are guests on WHA radio (970 AM) at 11:45 a.m. the last Monday of each month. Send them your questions at stevea@ssec.wisc.edu or jemarti1@wisc.edu.

Category: History, Meteorology

Comments Off on Why is May 6 such a special day in weather science history?

How do radars see tornadoes?

A weather radar consists of a transmitter and a receiver. The transmitter emits pulses of radio waves outward in a circular pattern. Precipitation scatters these radio waves.

“Reflectivity” is the amount of transmitted power returned to the radar and measured by its receiver. The intensity of this received signal indicates the intensity of the precipitation.

Classic hook echo on Doppler Radar
(Image credit: NWS Charleston, WV)

Measuring the time it takes for the radio wave to leave the radar and return tells us how far away the storm is. The direction the radar is pointing locates the storm.

A hook echo is a pattern in a reflectivity image. It looks like a spiral turning outward in a clockwise way, with the “thickness” of the precipitation increasing — or, a hook shape. This pattern suggests the storm is rotating and may produce a tornado. A tornado might be found at the spiral’s narrow apex.

Doppler radars measure how fast the particles in the cloud are moving toward or away from the radar. The returning radio waves have a higher frequency if the cloud particles are moving toward the radar, and a lower frequency if particles are moving away. This allows Doppler radars to identify severe weather. For example, a spinning vortex would have particles switch from moving toward and then away from the Doppler radar over a small distance.

A radio wave is an electromagnetic wave and therefore has electric and magnetic fields that are oriented perpendicular to one another. This is referred to as polarization. Dual polarized radars measure this polarization and can discern between heavy rain, hail, snow and sleet, as well as debris from a tornado.

When a tornado is on the ground, it lofts dirt, plant matter and other debris into the atmosphere. Because radar is designed to detect the presence of airborne objects, it can show meteorologists where debris is present and thus the tornado.

Steve Ackerman and Jonathan Martin, professors in the UW-Madison department of atmospheric and oceanic sciences, are guests on WHA radio (970 AM) at 11:45 a.m. the last Monday of each month. Send them your questions at stevea@ssec.wisc.edu or jemarti1@wisc.edu.

Category: Meteorology, Phenomena, Severe Weather

Comments Off on How do radars see tornadoes?

More April snow?

Weather map of a major winter storm bringing heavy snow and blizzard conditions to parts of the U.S. Northern Plains through April 12, 2022. (Image credit: NOAA)

The snow showers that visited our area on Thursday afternoon represented the fourth time snow had been in the air in Madison this month of April.

These showers were associated with the development and passage of a strong and sprawling cyclone that brought blizzard conditions to a number of locations in North Dakota and Montana from Tuesday night into Thursday. The town on Glenburn, North Dakota, received 30.5 inches of snow as of Thursday morning, with 30 to 36 inches variously reported around Minot.

These are exceptional, though not unprecedented, totals for April snows in the region. This exceptional event accounted for well over half of the entire season’s snowfall in many locations across North Dakota. In this particular instance, the severity of the late snow coupled with its duration and the accompanying wind gusts of up to 60 mph, put ranchers in the area in a difficult position as many were deep into the calving season. Ranchers prefer to keep their animals outside during the season, and newborn calves are at substantially higher risk of contracting pneumonia if they can’t stay dry after birth.

Thanks to decades of persistent advances in theory, observational technologies and computer modelling innovations, this storm was well forecasted and NWS warnings were issued well in advance of the onset of dangerous conditions. Consequently, the storm’s negative economic impact was greatly reduced.

Steve Ackerman and Jonathan Martin, professors in the UW-Madison department of atmospheric and oceanic sciences, are guests on WHA radio (970 AM) at 11:45 a.m. the last Monday of each month. Send them your questions at stevea@ssec.wisc.edu or jemarti1@wisc.edu.

Category: Meteorology, Seasons, Severe Weather

Comments Off on More April snow?

What was that stuff that fell on Wednesday and Thursday?

Graupel from Madison (Image credit: SSEC)

Last Wednesday and Thursday many locations in southern Wisconsin experienced snow squalls in which the falling precipitation was momentarily quite intense.

This event was an example of shallow convection — as opposed to the deep convection of summertime thunderstorms.

This shallow convection was spawned by a conspiracy of circumstances occurring at different levels in the atmosphere. Near the surface, the early morning sunshine led to an increase in the near-surface air temperature, while at about 3 miles above the ground the air was cooling rapidly as colder air at that level moved southward over the region.

Warming the surface and cooling the air at upper levels reduces the stability and encourages vigorous upward vertical motion and cloud production. What fell out of the sky was varied depending on your location, but many places saw snow grains, snow pellets or graupel.

These particles are frozen hydrometeors that maintain their original crystalline structure. When a preexisting piece of non-crystalline ice falls below the level at which the temperature is at or below 32 degrees, the freezing level, that particle accretes liquid water. When that particle is subsequently forced above the freezing level, that liquid coating freezes. A hailstone is produced when this process occurs several times before the particle is massive enough to fall to the ground.

Steve Ackerman and Jonathan Martin, professors in the UW-Madison department of atmospheric and oceanic sciences, are guests on WHA radio (970 AM) at 11:45 a.m. the last Monday of each month. Send them your questions at stevea@ssec.wisc.edu or jemarti1@wisc.edu.

Category: Meteorology, Seasons, Severe Weather

Comments Off on What was that stuff that fell on Wednesday and Thursday?