How does hail get its shape?

Hail is precipitation in the form of balls or chunks of ice.

Hailstones begin as small ice particles that grow primarily by accretion; to grow large, they require abundant water droplets. As the hailstone moves up and down through a storm, it collides with water droplets and ice crystals, growing larger with each collision. Hailstones can be smaller than peas or as large as oranges and grapefruits. The small hailstones are roughly spherical in shape, while large ones can take on jagged shapes.

When a hailstone is cut in half, you can see rings of ice. Some rings are milky white; others are clear. This ringed structure indicates that hailstones grow by two different processes: wet growth, represented by the clear layers, and dry growth, which forms the milky white layers. Counting the layers of clear and milky white ice gives an indication of how many times the hailstone traveled through the storm.

This hail stone from Madison Wisconsin exhibits both dry and wet growth. (Credit: M. Mooney)

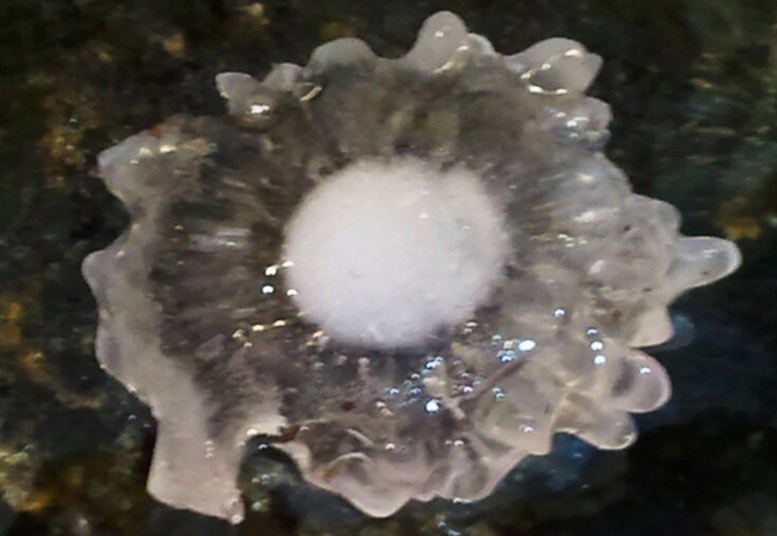
Dry growth of hailstones occurs when the air temperature is well below freezing. In these conditions a water droplet freezes immediately as it collides with the hailstone. This quick freezing leads to air bubbles “frozen” in place, leaving cloudy ice.

In wet growth, the hailstone is in a region of the storm where the air temperature is below freezing but not very cold. When the hailstone collides with a drop of water, the water does not freeze on the ice immediately. Instead, the liquid water spreads over the hailstones and slowly freezes. Because the water freezes slowly, air bubbles can escape, resulting in a layer of clear ice.

With wet hail growth, a thin layer of liquid water can remain on the surface of a hailstone. This thin layer helps hailstones that collide to freeze to each other, forming jagged shapes.

Steve Ackerman and Jonathan Martin, professors in the UWM Adison department of atmospheric and oceanic sciences, are guests on WHA radio (970 AM) at 11:45 a.m. the last Monday of each month. send them your questions at stevea@ssecwisc.edu or jemarti1@wisc.edu.

Category: Meteorology, Severe Weather

Comments Off on How does hail get its shape?

Are ‘chem trails’ a real thing?

For years we have fielded questions on our monthly radio show on WHA regarding the nature of condensation trails left in the wake of jet airliners.

Widespread contrails over the southeast U.S. in January 2004. Credit: NASA MODIS

These contrails are composed of ice crystals that develop from the exhaust of jet engines in portions of the atmosphere that contain sufficient water vapor. Sometimes these condensation trails can persist for a very long time because the environmental conditions are moist enough that sublimation (the direct transformation from solid ice to invisible water vapor) is easily resisted by the aircraft-produced ice particles.

Sometimes there is not enough water vapor available along a portion of a flight route for the formation of a trail. The variability of upper tropospheric water vapor is such that sometimes the same aircraft can create a condensation trail along a segment of its track and nothing along an immediately adjacent segment.

With the increase in air travel over the past half century, these interesting, thoroughly explainable and naturally occurring results of air travel have become the font of an enduring conspiracy theory which suggests the condensation trails are actually “chem trails” — short for “chemical trails.” The idea is that some governmental agency is responsible for producing these “chem trails” for any of a number of malevolent purposes, including altering precipitation patterns so as to create drought, altering the chemical composition of the atmosphere so as to promote global cooling, etc.

None of these theories is in any way valid — and all of them disregard the enormous scale of the clandestine enterprise that would need to be taking place in order for such schemes to have any discernible impact on the atmosphere. It has taken over a century of continuing, unchecked increase in carbon dioxide from the burning of fossil fuels to have produced the actual climate change that many of the same people warning about “chem trails” deny has even begun. And yet, just last week, the state of Tennessee succumbed to this nonsense and passed a bill that forbids “intentional injection, release, or dispersion” of chemicals into the air — code for eliminating “chem trails.”

We live in a strange time.

Steve Ackerman and Jonathan Martin, professors in the UW-Madison department of atmospheric and oceanic sciences, are guests on WHA radio (970 AM) at 11:45 a.m. the last Monday of each month. Send them your questions at stevea@ssec.wisc.edu or jemarti1@wisc.edu.

Category: Phenomena

Comments Off on Are ‘chem trails’ a real thing?

Did the total solar eclipse impact the weather?

If you were in the path of the total solar eclipse last week, you may have observed a change in your environment. The more sunlight that was blocked, the more dramatic the changes.

Skiers and hikers on Saddleback Mountain in Maine during the April 8 total solar eclipse. (Photo credit: R. Bukaty, Associated Press)

A range of surface and near-surface meteorological observations can occur during a total solar eclipse. If it was a cloud-free day, or mostly cloudy day, you probably felt a drop in temperature. As the moon crossed in front of sun, it cast a shadow blocking solar energy from reaching your location. While it may have lasted only a few minutes, the reduction in solar radiation would result in a drop in temperature. In some locations, the temperature dropped by as much as 10 degrees. As the sun reappeared, the temperature increased.

A drop in temperature would include a corresponding increase in the relative humidity. So, it might have felt more humid. You may have also observed a change in the wind speed.

The planetary boundary layer, also referred to as the atmospheric boundary layer, is the lowest part of our atmosphere. It is about 0.6 miles thick and is where the atmosphere exchanges energy directly with the ground. The exchanges are primarily mechanical (e.g. wind and turbulence) and thermal. The thermal contact between the boundary layer and the ground surface is a result of the amount of solar radiation.

You may have already observed, in the absence of a storm, that after sundown the wind calms. When the sun sets, the radiative cooling of the ground increases the stability of the lower atmosphere. This reduces the energy exchanges between the atmosphere and the surface. This can result in the wind dying down. The drop in temperature you experienced during the eclipse would similarly cool the ground.

Steve Ackerman and Jonathan Martin, professors in the UW-Madison department of atmospheric and oceanic sciences, are guests on WHA radio (970 AM) at 11:45 a.m. the last Monday of each month. Send them your questions at stevea@ssec.wisc.edu or jemarti1@wisc.edu.

Category: Meteorology, Phenomena

Comments Off on Did the total solar eclipse impact the weather?

Has our plant hardiness zone changed?

This new Plant Hardiness Zone Map was generated from the past three decades of data reflecting overall warming, especially in overnight lows. The data mostly comes from weather stations and reveals a general trend of warmer temperatures, as zones tending to be farther north in the 2023 map. (Image credit: USDA)

If you are involved with gardening, you probably are aware of the Plant Hardiness Zone Map, or PHZM, often listed on seed packets. The U.S. Department of Agriculture developed the zones and first published them in 1960. The USDA updated them in 2012 and more recently in November 2023.

A hardiness zone provides information on the type of plants capable of surviving certain climatic conditions. The designations are based on the “average annual extreme minimum temperature” at a given location during a particular 30-year period. The climate zones are determined from temperature records kept by National Atmospheric and Oceanic Administration.

Every 10 years NOAA computes a revised 30-year average temperature and extreme temperatures for the U.S. using climate observations collected at local weather stations across the country. The newest revision spans the 30-year period from 1991 to 2020. The influence of long-term global warming is reflected in the revised temperatures. The 30-year average minimum winter temperatures increased at nearly all locations in the continental U.S.

The revised PHZM reflects this climate change. Compared with the 2012 map, the 2023 designation shows that about half of the country shifted to the next warmer half zone, and the other half of the country remained in the same half zone. Previously, northwestern Wisconsin was in zones 4a and 3b; the revised map indicates the region to be zone 4a. The colder zone of 3b is no longer a designation in Wisconsin.

While the hardiness zones are very useful, they cannot account for all climate and weather conditions such as snowfall, which can insulate the plants during a cold winter, or severe summertime heat. In addition to knowing your plant hardiness zone, it is also very useful to talk with local master gardeners and nurseries as you plan your plantings this season.

Steve Ackerman and Jonathan Martin, professors in the UW-Madison department of atmospheric and oceanic sciences, are guests on WHA radio (970 AM) at 11:45 a.m. the last Monday of each month. Send them your questions at stevea@ssec.wisc.edu or jemarti1@wisc.edu.

Category: Climate, Seasons

Comments Off on Has our plant hardiness zone changed?

How is visibility distance evaluated for a weather map?

The weather observing stations of the National Weather Service operate in fully automatic mode and have sensors that measure visibility.

National Weather Service (NWS) Automated Surface Observing System (ASOS). (Photo credit: NOAA/NWS)

These instruments sense the forward scattering characteristics of light to measure the extinction coefficient of a high intensity beam directed at a volume of air close to the sensor. This provides an accurate measurement over a range of visibilities. The use of light within the visible spectrum also allows the sensor to simulate human perception of visibility.

There are a smaller number of stations where there is still a human observer to estimate visibility (e.g. at airfields). When people make the measurements, they are estimating the maximum distance away that they can see an object located near or on the ground. The object should be identifiable against the background. If the visibility varies with direction, the lowest value is reported.

A person with 20/20 vision who is about 5 feet tall can see a horizontal distance of about 3 miles along a flat ground surface. The human eye is more sensitive and can see a greater distance, but 3 miles is the point at which Earth’s curvature bends away. The instrument observations employ physics and are not concerned with Earth’s curvature.

We are all interested in horizontal visibility as it has major implications for transportation. The measurement is made at weather stations since visibility is dependent on current weather.

Horizontal visibility near the ground is one of the observations plotted on a station model. It is measured in fractions of a mile, unless there is an obstruction due to current weather conditions, such as fog, rain or smoke. If the visibility is above 10 miles, the values are either omitted from the map or listed at 10 miles.

Steve Ackerman and Jonathan Martin, professors in the UW-Madison department of atmospheric and oceanic sciences, are guests on WHA radio (970 AM) at 11:45 a.m. the last Monday of each month. Send them your questions at stevea@ssec.wisc.edu or jemarti1@wisc.edu.

Category: Meteorology

Comments Off on How is visibility distance evaluated for a weather map?