The National Weather Service is expecting the 2024 Atlantic hurricane season to be an extremely active one. The forecast predicts 17 to 25 total named storms. Such storms have sustained winds of 38 mph or higher. Additionally, four to seven of those storms may fall into the major hurricane category, with sustained winds of 111 mph or higher.
An average year sees 14 named storms during hurricane season, which runs from June 1 to November 30.
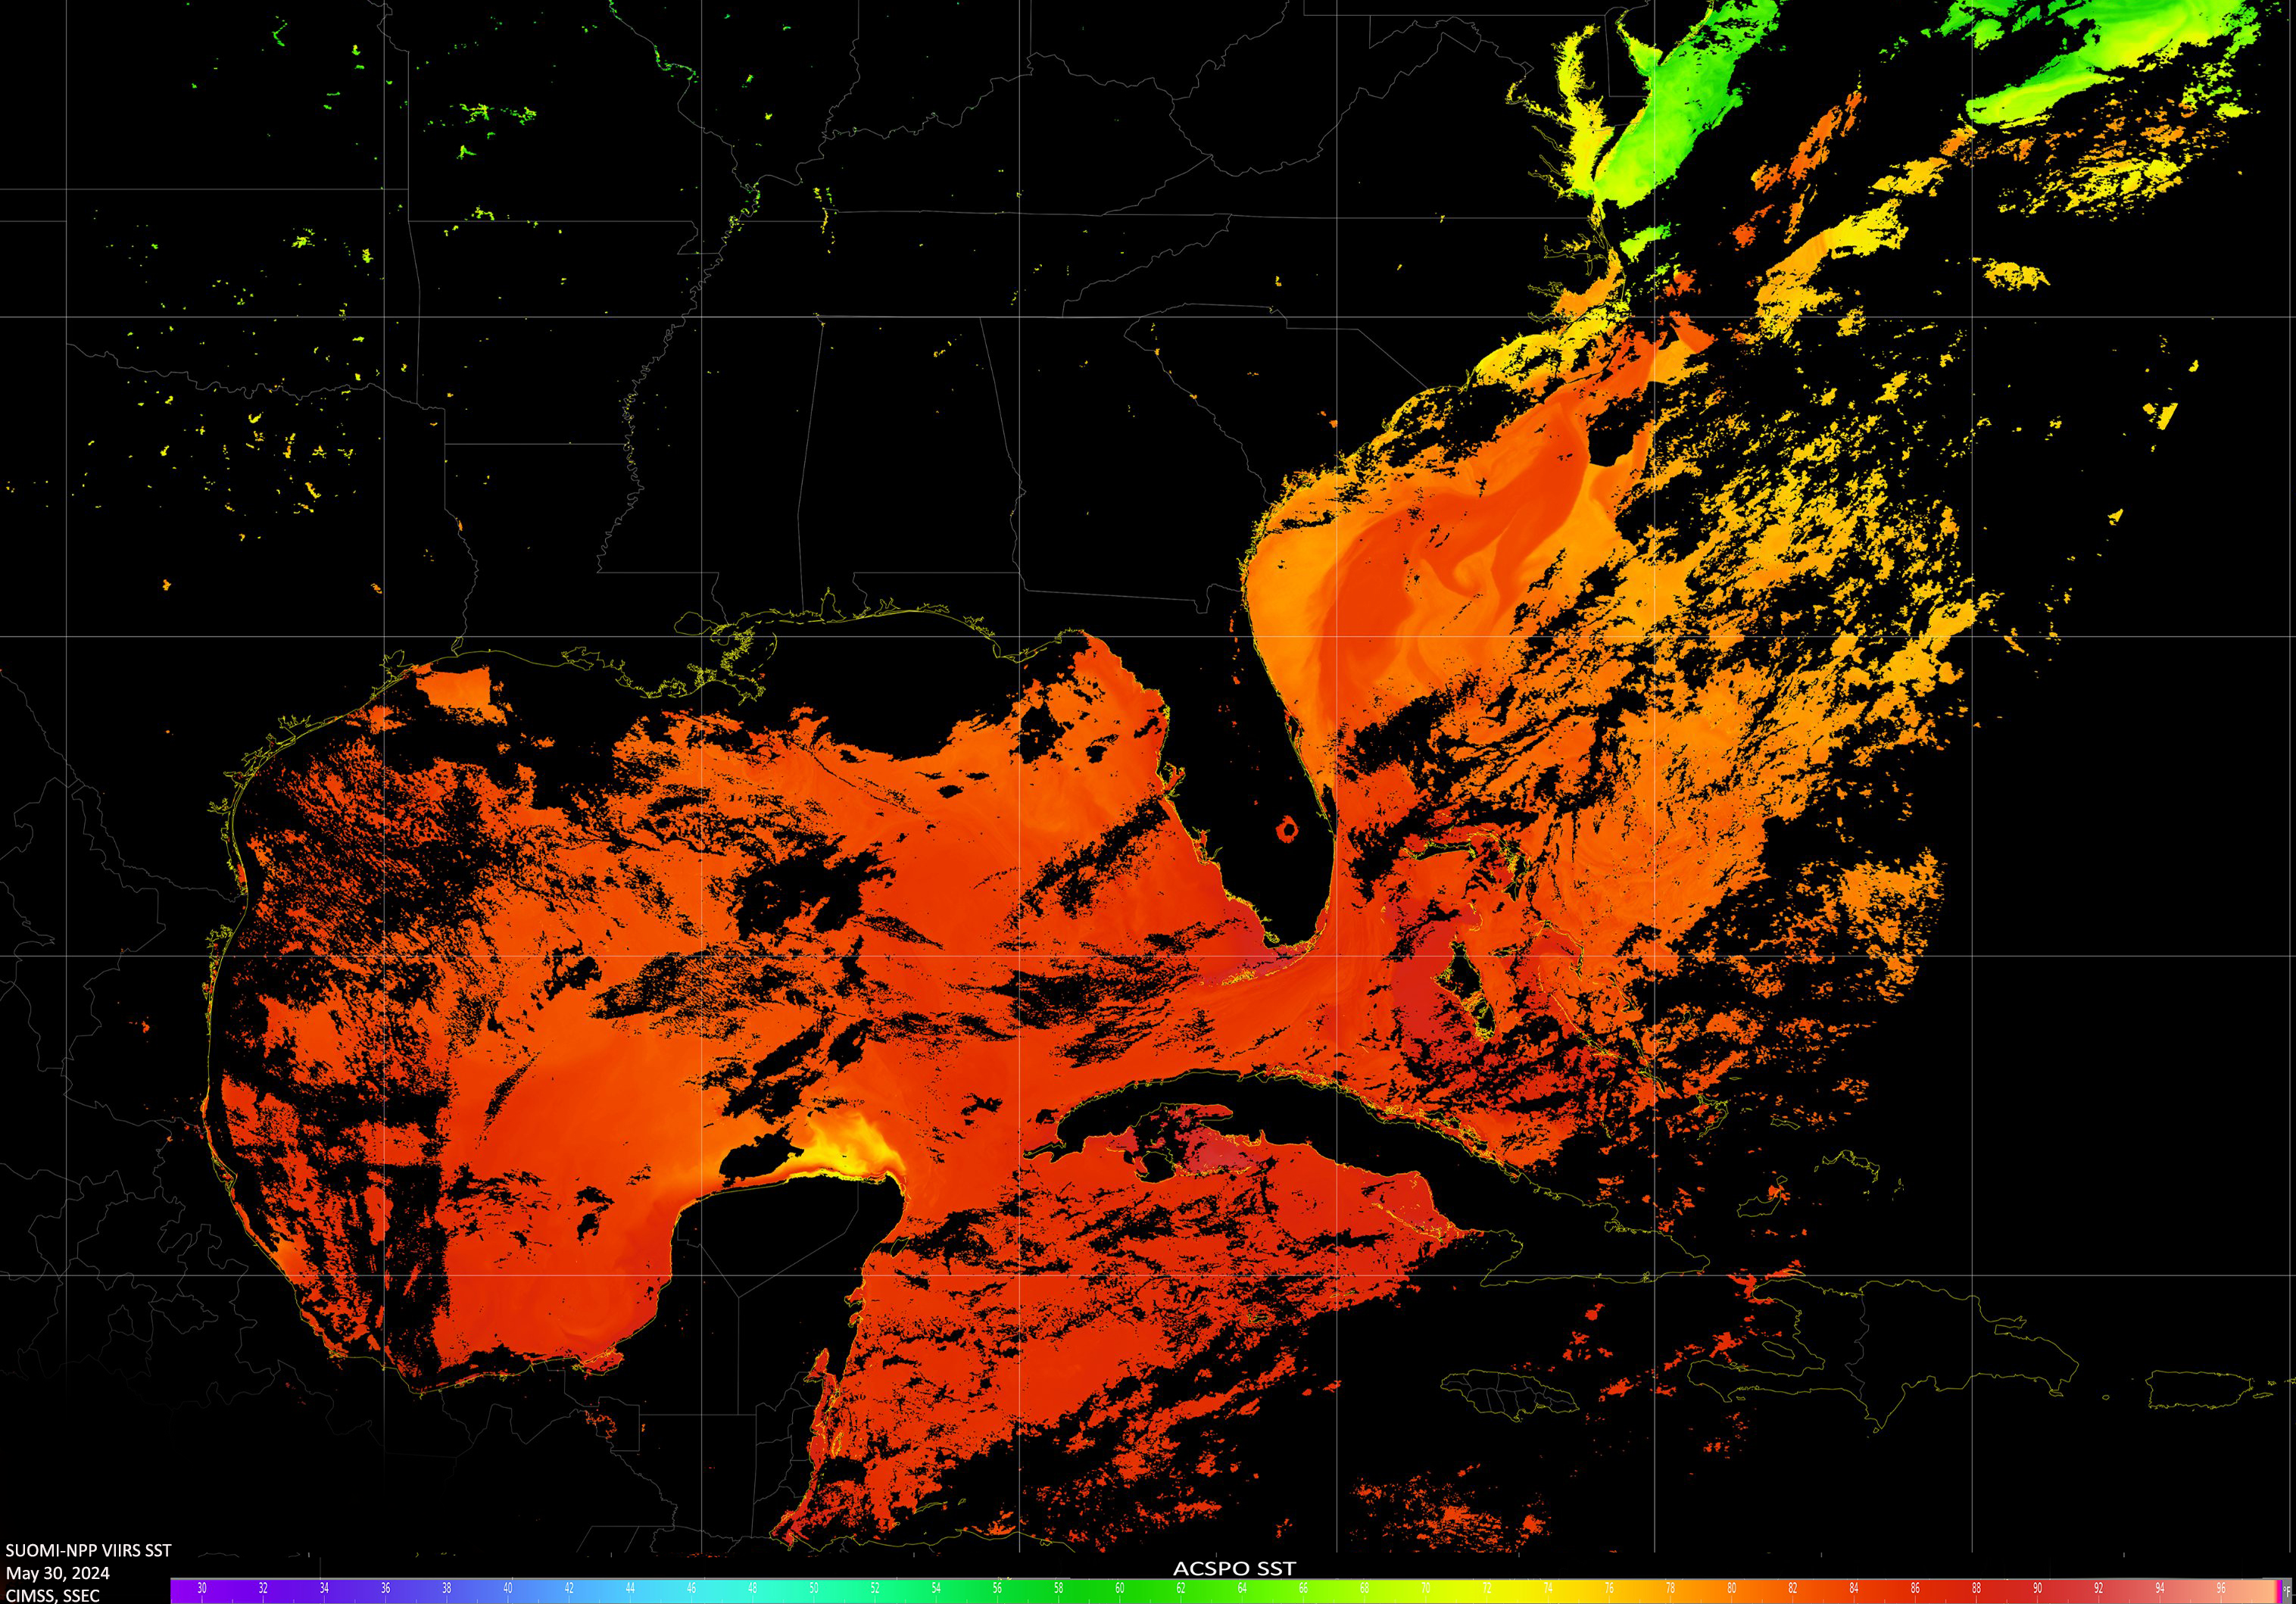
One factor contributing to an above-average hurricane season is the near-record warm ocean temperatures in the Atlantic Ocean. Warm ocean temperatures increase evaporation, which provides energy for a storm to develop and intensify. The ocean waters must be above 26.5 C, or 79.7 F, for hurricanes to form and sustain. Large regions of the tropical East Pacific and the tropical Atlantic surpass this threshold.
The forecast is also driven by the atmospheric circulation pattern transitioning from El Niño to La Niña conditions. El Niño and La Niña are the two extremes of a recurring climate pattern that can affect weather around the world. On average, La Niña years are above-average hurricane years. La Niña creates conditions for less vertical wind shear, which refers to the change in wind speed and direction between roughly 5,000 and 35,000 feet above the surface. Hurricanes will not form when the upper-level winds are too strong. Strong upper-level winds inhibit the storms’ structure by displacing the warm temperatures above the eye and limiting the vertical ascent of air parcels.
Typhoons are tropical storms that form over the Pacific Ocean. While La Niña tends to increase hurricanes in the Atlantic, those conditions tend to decrease the number of typhoons in the eastern and central Pacific Ocean basins.
Steve Ackerman and Jonathan Martin, professors in the UW-Madison department of atmospheric and oceanic sciences, are guests on WHA radio (970 AM) at 11:45 a.m. the last Monday of each month. send them your questions at stevea@ssec.wisc.edu or jemarti1@wisc.edu.