Because clouds are involved in the global water cycle as well as our planet’s energy gains and losses, they constitute an important component of our atmosphere, weather, and climate.
Determining global cloud cover requires observations that cover the entire planet. Observations from weather satellites provide a modern estimate of the global cloud cover. These satellites are operated by several countries and their data is shared through international agreements. Discrimination between clear and cloudy regions is a crucial first step in most applications of satellite data, such as estimating ocean temperature or assessing the health of land vegetation.
Clouds are generally brighter and colder than the underlying surfaces. During daylight most clouds are detected via reflection of visible and near infrared energy coming from our sun. At visible wavelengths, snow surfaces can be as bright as clouds, making cloud detection a bit more challenging. But at other wavelengths, ones our eyes cannot detect, clouds and snow appear very different. During day, clouds are often colder than the underlying service and so infrared observations help in cloud detection. At night, contrasts in temperatures between cloud and the surface are sufficient for the detection of most middle and high-altitude clouds. However, there can be challenges with low altitude clouds, where the ground can become colder or at the same temperature as the clouds at night.
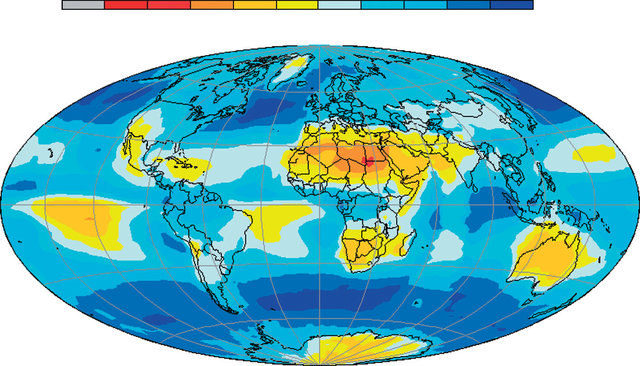
Global cloud cover is approximately 65% with the average cloud cover over ocean exceeding the average over land. Cloud cover over land tends to be greater in daytime than at night, while the ocean shows little day–night difference.
Modern satellite observations can also be used to assess additional cloud properties, such as altitude and whether the clouds are composed of ice crystals or liquid water droplets.
Steve Ackerman and Jonathan Martin, professors in the UW-Madison department of atmospheric and oceanic sciences, are guests on WHA radio (970 AM) at noon the last Monday of each month. Send them your questions at stevea@ssec.wisc.edu or jemarti1@wisc.edu.