How accurate was the forecast for Hurricane Michael?

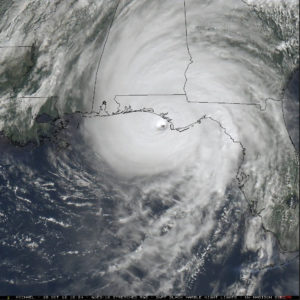
GOES East (GOES-16) satellite image
of Hurricane Michael. click to animate

Five days in advance of Hurricane Michael’s landfall, the National Hurricane Center forecast showed the storm making landfall near Mexico Beach, Florida, with 80 mph winds, just above Category 1 hurricane force.

As we all know by now, the storm lashed the coast with winds in the 155-mph range, or strong Category 4 intensity.

Thus, as is often the case, the forecast of the storm’s path was excellent while the forecast of its intensity was not.

In addition to wind speeds, the intensity of hurricanes is also commonly measured by how low the barometric pressure gets at their centers. Michael recorded the fourth-lowest sea-level pressure of all storms that made landfall in U.S. history.

Why was the eventual intensity of Michael so poorly predicted? A component of the answer is that we lack the density of data required to take full advantage of the computer-modeling technology that underlies short-term forecasting.

The models themselves are forced to make numerical approximations to a number of influential physical processes, such as ocean temperatures and heat content, changes in wind direction with altitude, and interactions with land that control intensification of hurricanes.

Specifically for Michael, early forecasts did predict intensification but not at the rate that was actually observed. Early in its life cycle, Michael was in an unfavorable environment for intensification due to wind shear (change in the wind direction with altitude).

Later the storm moved over some very warm water in the Gulf of Mexico and into an atmosphere with less wind shear. As a result, explosive intensification ensued.

Despite the current difficulties, hurricane forecasts are getting better and improvements will continue but intensification will remain difficult to foresee.

The most important lesson from this storm, if you are in a forecast area in which a hurricane is predicted, and are asked to evacuate — you should do so.

Steve Ackerman and Jonathan Martin, professors in the UW-Madison Department of Atmospheric and Oceanic Sciences, are guests on WHA radio (970 AM) at 11:45 a.m. the last Monday of each month.
Category: Severe Weather, Tropical, Weather Dangers

Comments Off on How accurate was the forecast for Hurricane Michael?

Is the Earth’s spin axis drifting?

The Earth, represented here by a globe on display at the Wisconsin Dairy Expo, wobbles on its axis every 27,000 years. (Photo credit: State Journal Archives)

The Earth revolves around an imaginary line that passes through the North and South Poles, known as the spin axis. As it spins the Earth drifts and wobbles. And now scientists have identified three reasons.

The Earth wobbles on its axis once every 27,000 years, similar to a spinning top. This alters the relationship between the solstices and the distance from the Earth to the Sun. For example, 11,000 years ago the Northern Hemisphere summer solstice occurred at perihelion, when the Earth is closest to the Sun. That is almost the exact opposite of the case today,

This “synching up” of summertime with perihelion made the differences between winter and summer more pronounced 11,000 years ago than they are today.

More generally, the solstices and equinoxes move slowly forward through the calendar with each passing year, a phenomenon known as precession.

Earth’s spin axis also drifts. Measurements indicate the spin axis drifts by about 4 inches per year, or more than 11 yards over a century.

Earth isn’t a perfectly round spinning object. There are three processes that redistribute mass that cause the spin axis to move:

  • Changes in Earth’s mantle caused by convection in Earth’s interior;
  • Mass loss due to melting of ice (mostly on Greenland); and
  • Uplift of land that was once buried under glaciers.

The melting of Greenland glaciers into the oceans has redistributed mass resulting in the spin axis drift.

That melting along with Greenland’s location makes it a significant contributor to polar motion.

Greenland’s ice mass has decreased by a weight that is larger than 20 million Empire State Buildings.

Category: Climate, Seasons

Comments Off on Is the Earth’s spin axis drifting?

How is the Arctic sea ice doing?

The 12 smallest summertime minimums of Arctic sea ice have all occurred in the past 12 years. (NSIDC graphic)

One of several diagnostic signals of a warming climate is the extent of sea ice in the Arctic, particularly its annual minimum extent which often arrives around the autumnal equinox.

The sea-ice extent is directly measured by satellite data and is available through the NASA-supported National Snow and Ice Data Center at the University of Colorado-Boulder.

This year’s minimum occurred on Sept. 19 and again on Sept. 23 when the sea-ice extent shrunk to 1.77 million square miles — the sixth-lowest summertime minimum in the nearly 40-year satellite record.

The 2018 minimum was 629,000 square miles below the 1981-2010 average, continuing a trend in which a portion of sea-ice the size of Maryland and New Jersey combined has been lost each successive year in these past four decades.

The 12 smallest summertime minimums have all occurred in the past 12 years.

That is yet another unequivocal signal of the gradual warming occurring over the entire globe.

The sea ice is a very important aspect of a positive feedback that can accelerate that warming.

As the ice cover decreases each year at the end of the summer, the amount of open water increases. Open water is much better at absorbing incoming solar radiation than the highly reflective, snow covered ice.

Consequently, refreezing of the water into wintertime pack ice is retarded by the increased absorption of sunshine. That leads to thinner ice on the margins of the ice cap at the end of the winter which makes it easier for melting in the summer to expose even more open water at the end of each successive warm season.

Current research is examining the influence of this systematic reduction of Arctic sea-ice on changes in the autumn/winter atmospheric circulation of the Northern Hemisphere.

Steve Ackerman and Jonathan Martin, professors in the UW-Madison Department of Atmospheric and Oceanic Sciences, are guests on WHA radio (970 AM) at 11:45 a.m. the last Monday of each month.
Category: Climate, Seasons

Comments Off on How is the Arctic sea ice doing?

Why does it get colder in the fall and winter?

September 22 GOES East satellite image

After a fairly prolonged stretch of warm and humid weather through mid-September, culminating in a temperature of 82 degrees just before midnight on Thursday, southern Wisconsin residents were greeted with low temperatures in the 40s on Saturday morning.

This seems particularly fitting as Saturday, Sept. 22, was the day of the autumnal equinox this year — fall officially arrived at 8:54 p.m. that night.

In  the past three months, we have lost over 3 hours of daylight and over the next three we will lose an additional 3 hours.

The situation is even worse at higher latitudes. At the North Pole, for instance, the sun dipped below the horizon Saturday night for the first time in six months and will not be seen again for six more months.

The polar darkness will now begin its inevitable creep southward, reaching 66 degrees 30 minutes latitude just before Christmas Day.

Thus, a gradually expanding area of the Northern Hemisphere will be plunged into daylong darkness with each passing day. In the absence of any sunlight, the air in these locations will be subject to uninterrupted radiational cooling, which will lead to the production of very cold air masses.

The cold air will continue to advance southward across the hemisphere through about the last week of January when it will begin its slow retreat back toward the pole as winter begins to lessen its grip.

So, as we all enjoy these first few days of fall, their magnificence comes with a hidden, lurking price and the bill will come due in December, January and February.

Steve Ackerman and Jonathan Martin, professors in the UW-Madison Department of Atmospheric and Oceanic Sciences, are guests on WHA radio (970 AM) at 11:45 a.m. the last Monday of each month.
Category: Meteorology, Seasons

Comments Off on Why does it get colder in the fall and winter?

How normal was this summer’s weather?

Overnight Low Temperatures by County

In southern Wisconsin, the average temperature for the summer months — defined as June, July and August — was near normal.

Rainfall was a different story. All of southern Wisconsin had summer accumulated precipitation of more than 16 inches, or 125 percent of normal. For much of the region, accumulated precipitation in August was more than 7 inches, which is more than 175 percent of normal.

August saw very heavy rainfall on areas of Wisconsin. Exceptionally heavy rain fell in south-central Wisconsin between Aug. 20 and Aug. 22. Storms formed and reformed over the same areas, resulting in 13.02 inches of rain in Middleton and 11.14 inches at Charmany Farm, southwest of Madison.

Unofficial reports had totals of more than 14 inches near Cross Plains. This led to flash flooding in many areas and high lake levels. Additional rains resulted in historic flooding that devastated parts of southern Wisconsin the following week.

Seventeen tornadoes were reported in southeastern Wisconsin on Aug. 28. Only one of these tornadoes was rated EF-2, while the rest were rated either EF-1 or EF-0. No injuries or fatalities were reported. Multiple weak tornadoes were also reported in southern Wisconsin on June 26, and on June 16 a brief EF-0 tornado touched down near Poynette.

As for the rest of the nation, most experienced a summer of above-average temperatures. The nationally averaged overnight lows were exceptionally warm this summer, 2.5 degrees above average and 0.1 degrees warmer than the previous record set in 2016.

In general, the U.S. summer overnight low temperatures are warming at a rate nearly twice as fast as afternoon high temperatures. The 10 warmest summer minimum temperatures have all occurred since 2002.

Above-average precipitation was observed from the Great Plains to the East Coast, while below-average precipitation was observed for much of the West and parts of the South.

Category: Climate, Meteorology, Seasons

Comments Off on How normal was this summer’s weather?