Is hurricane forecasting improving?

GOES-16 “Clean” Infrared Window (10.35 µm) and “Red” Visible (0.64 µm) images (Image credit: CIMSS Satellite Blog)

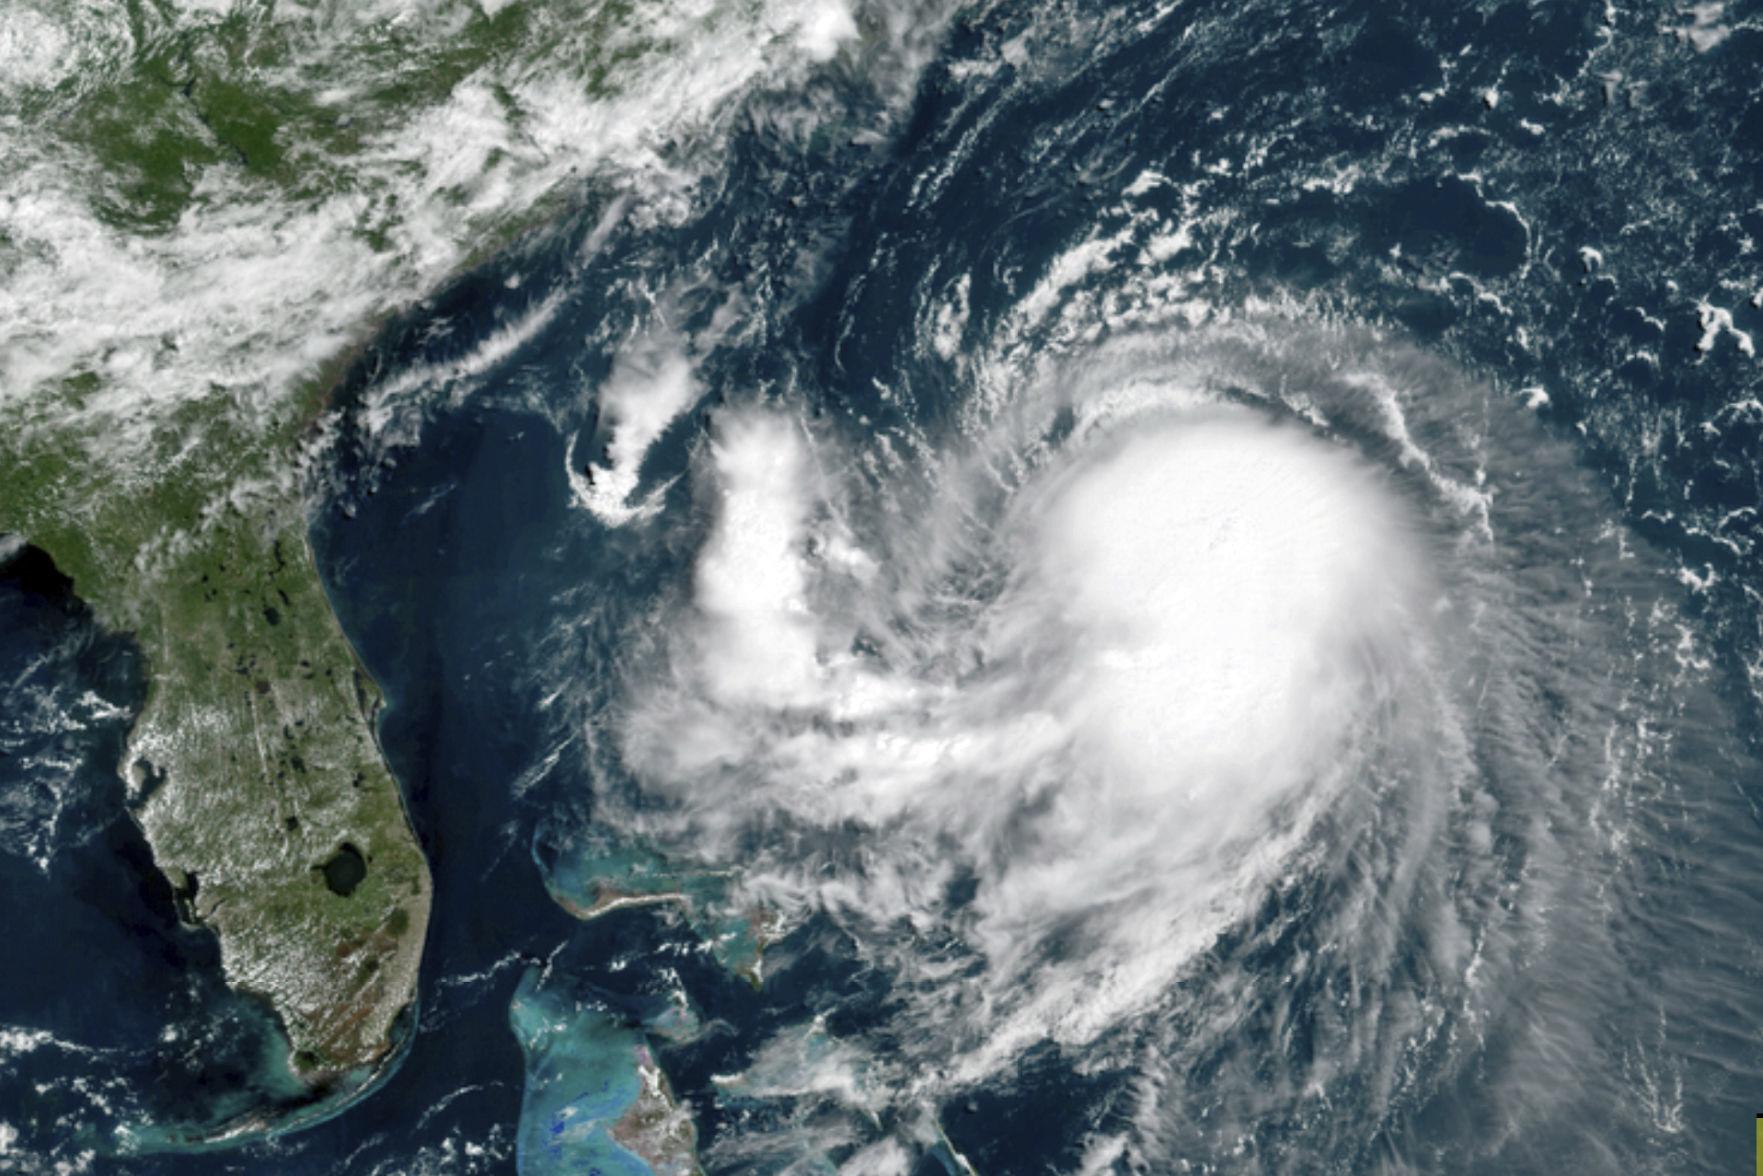
There are two important components of hurricane forecasting: the hurricane track (where it is going) and hurricane intensity (how and if its winds are increasing).

Hurricane forecasts are becoming more accurate and are extending further out in time. Accurate forecasts provide needed information to make sound decisions and effective risk communication. In addition to improved hurricane forecasts, technological advances, such as smart phone apps, are making the information more accessible and can alert those in harm’s way.

Track forecast error is defined as the great-circle distance between a hurricane’s forecast position and the actual position at the forecast verification time. As one might expect, the errors get larger the further out the forecast.

The 24- and 72-hour track forecast errors over the past 30 years have improved, a trend where the errors have decreased by 70 to 75%. Consider the 2020 hurricane season as an example. This was an extremely active year, having 30 named storms. The 2020 mean track errors were 41 miles at 24-hour forecast, while during the period 2005-2010, the 24-hour track forecast error was 58 miles. Track forecast error reductions of about 60% have occurred over the past 15 to 20 years for the 96- and 120-hour forecast periods.

The improvement in hurricane track forecasts is due to several factors. We now have better and more satellite observations, new observations from drones carrying weather instruments, and more aircraft with better instruments observing hurricanes. Super computers that are faster improve forecast models by allowing more energy and dynamic processes to be incorporated more explicitly into the forecast. Due to improved observations, we can include better descriptions of the initial state of the atmosphere into the models, which leads to more accurate predictions of a storm’s behavior.

Forecasting the intensity of a hurricane has only gradually improved in the last two decades, so work remains to be done in that arena. While we still lack the ability to accurately forecast hurricane intensity, our understanding of how hurricanes evolve has grown substantially.

Steve Ackerman and Jonathan Martin, professors in the UW-Madison department of atmospheric and oceanic sciences, are guests on WHA radio (970 AM) at 11:45 a.m. the last Monday of each month. Send them your questions at stevea@ssec.wisc.edu or jemarti1@wisc.edu.

Category: Meteorology, Severe Weather, Tropical

Comments Off on Is hurricane forecasting improving?

How often does New England deal with hurricanes?

New England dealt with Tropical Storm Henri over the past weekend — nearly the first hurricane to make landfall in New England in 30 years.

This satellite image taken Friday at 11:40 a.m. Eastern shows Tropical Storm Henri in the Atlantic Ocean. (Image credit: NOAA)

As it turns out, that long interval between landfalling hurricanes in that region is unusually long.

It is not terribly uncommon for Atlantic hurricanes to affect the New England states or even the Maritime Provinces of Canada. The reason they are not even more common that far north is because hurricanes are fueled by evaporation of water vapor off the ocean and its subsequent conversion to liquid water (in the form of torrential rains) that releases enormous amounts of so-called latent heat energy to the atmosphere.

This evaporation is greatly enhanced over a very warm sea surface. In fact, sea-surface temperatures of 26 degrees Celsius (about 79 degrees Fahrenheit) are necessary for the formation of nearly all tropical cyclones, some of which mature into hurricanes.

The shelf waters of the Atlantic Ocean, north of Cape Hatteras, North Carolina, are well below that threshold temperature so very few tropical storms continue to strengthen as they surge northward along the Atlantic coast.

The Gulf Stream current, which roars northward along the east coast of North America, usually turns out to sea at about the latitude of the Carolinas. However, the Gulf Stream occasionally has high-amplitude meanders in it (not unlike the waves in our troposphere) that can temporarily force its warm waters much farther north than normal.

Some of the more famous landfalling hurricanes in New England history may well have been associated with such meanders. Luckily, Tropical Storm Henri will most likely serve only as a helpful reminder to a new generation of New Englanders that they are not immune from these destructive storms.

Steve Ackerman and Jonathan Martin, professors in the UW-Madison department of atmospheric and oceanic sciences, are guests on WHA radio (970 AM) at 11:45 a.m. the last Monday of each month. Send them your questions at stevea@ssec.wisc.edu or jemarti1@wisc.edu.

Category: History, Meteorology, Severe Weather, Tropical

Comments Off on How often does New England deal with hurricanes?

What holds clouds up, and why are some fluffy on top but flat on the bottom?

Cumulus clouds often appear flat on the bottom revealing the lifted condensation level (LCL) the height in the atmosphere where rising air changes phase from water vapor to tiny liquid water droplets. (Photo credit: Steven A. Ackerman)

One of our readers awoke to some beautiful clouds in the summer sky recently, and those two excellent questions popped into her mind.

Clouds are composed of tiny liquid water droplets (whose diameters are about the width of a human hair) and tiny shards of ice in a variety of shapes.

Whether a cloud is mostly liquid water droplets or ice particles depends, as you might guess, on the temperature of the air in the cloud.

Tiny cloud liquid water droplets can remain in the liquid state to temperatures as low as about -10 degrees Celsius (14 degrees Fahrenheit), and when they do they are known as supercooled liquid water droplets.

These droplets feel the downward force of gravity just like a baseball or a watermelon would. But because the droplets are so small, and therefore have small masses, the gravitational force can easily be balanced by an upward friction force resulting from the interaction of the droplets with the air molecules around them. The droplets remain suspended, and that’s what holds clouds up in the air.

When these droplets grow, they gain mass and eventually the gravitational force overwhelms the friction force and the now-larger droplets fall to the surface.

The fluffy appearance of the tops of some clouds are evidence of convection, when buoyant air parcels within the cloud literally bubble to the top. As the air rises, it encounters environments with lower and lower pressure and cools by expansion.

This cooling increases the relative humidity of the air. Once that relative humidity gets to 100%, condensation of the invisible water vapor begins to produce liquid water droplets. The bottom of clouds often appears flat because the first level at which rising air parcels begin to condense is usually rather uniform over a given region. This level is known as the lifted condensation level — that is, the level at which lifted air parcels first begin to experience condensation.

Steve Ackerman and Jonathan Martin, professors in the UW-Madison department of atmospheric and oceanic sciences, are guests on WHA radio (970 AM) at 11:45 a.m. the last Monday of each month. Send them your questions at stevea @ssec.wisc.edu or jemarti1 @wisc.edu.

Category: Uncategorized

Comments Off on What holds clouds up, and why are some fluffy on top but flat on the bottom?

It’s rained a bit lately. So is the drought over yet in southern Wisconsin?

The accumulated lack of precipitation we experienced the first part of this year has produced severe drought conditions in southern Lafayette, southern Walworth, Racine and Kenosha counties as of the end of last week.

(Image credit: Brad Rippey, USDA)

Moderate drought continues across southern Sauk, southern Columbia, Dodge, Washington, Ozaukee, Iowa, Dane, Jefferson, Waukesha, Milwaukee, Green and Rock counties as well.

Since Aug. 1, 2020, Madison has recorded a deficit of 10.34 inches of precipitation. That translates to only 71.6% of the area’s normal amount of precipitation over that interval.

Most alarming is that the growing season months of April, May and now July have contributed 7.04 inches of that 10.34-inch deficit. As a result, 33% of the region’s top soil and 35% of its subsoil moisture is currently considered “short” or “very short” by the National Weather Service’s U.S. Drought Monitor.

Some crops are beginning to show signs of stress under these conditions.

To make matters worse, there appears to be no relief on the immediate horizon. Any precipitation in the next seven or so days — if it occurs at all — will likely be the result of local thundershowers and will not be associated with the passage of a well-organized, “synoptic-scale” weather system (covering hundreds or thousands of miles) capable of delivering widespread precipitation.

In addition, the monthly climatological drop-off in precipitation from August (4.27 inches is normal) to September (3.13 inches is normal) is the largest such drop-off in the calendar year.

Consequently, a wet August is perhaps our last best hope for returning closer to normal and forestalling a compromised growing season.

Steve Ackerman and Jonathan Martin, professors in the UW-Madison department of atmospheric and oceanic sciences, are guests on WHA radio (970 AM) at 11:45 a.m. the last Monday of each month. Send them your questions at stevea@ssec.wisc.edu or jemarti1@wisc.edu.

Category: Uncategorized

Comments Off on It’s rained a bit lately. So is the drought over yet in southern Wisconsin?

Why is the high temperature forecast sometimes too high?

We are in the midst of another hot spell here in southern Wisconsin.

NOAA’s smoke forecast vertically integrated from the surface to the top of the atmosphere on July 27, 2021. (Image credit: NOAA)

Last Friday was the first of several days that were forecast to see high temperatures at or above 90 degrees (we’ve had only six through Friday all season!).

The high on Friday only reached 88 as the sky was a bit more obscured than was forecasted.

The obscuring factor was a combination of high cirrus clouds and smoke from the Western wildfires. The first of those factors, high cirrus clouds, is a common summertime suppressor of the high temperature.

Their exact location, timing and duration are very hard to predict accurately and so they are often the primary reason why a given summer day’s high temperature forecast might be too high.

Despite the difficulty of forecasting high clouds, the numerical models used by the National Center for Environmental Prediction (NCEP) are designed to simulate their development through the routine inclusion of humidity, wind and temperature data in the models.

The other factor conspiring to lessen the heat on these several days, wildfire smoke, is not well accounted for in those same models.

Because such large-scale smoke plumes are only episodic it is much more difficult to confidently account for their presence in these forecast models.

Smoke definitely reduces the amount of sunlight that is absorbed at the ground and so conspires to keep the temperature a bit cooler than it might have been in the absence of the smoke.

So, if the forecasted high temperatures over the weekend and early this week seem to be systematically a bit too high, it might well be a direct result of the wildfires that are raging in the Western states.

Steve Ackerman and Jonathan Martin, professors in the UW-Madison department of atmospheric and oceanic sciences, are guests on WHA radio (970 AM) at 11:45 a.m. the last Monday of each month. Send them your questions at stevea@ssec.wisc.edu or jemarti1@wisc.edu.

Category: Uncategorized

Comments Off on Why is the high temperature forecast sometimes too high?