Was that a tropical storm last week?

The path of Tropical Storm Cristobal as it was predicted to move through Wisconsin Tuesday and Wednesday, unleashing heavy rains and gusty winds. Photo credit: NOAA/National Hurricane Center

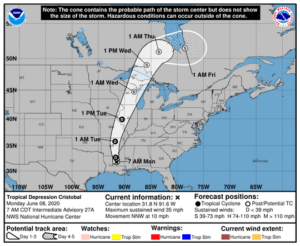
The western Great Lakes region was visited by a rare tropical storm Tuesday when Cristobal made its way into southern Wisconsin.

Rainfall from eastern Iowa to central Wisconsin was intense, with Madison, La Crosse, Wausau and Rhinelander all recording just under 2 inches of rainfall overnight Tuesday into Wednesday. Even more impressive rainfalls were recorded in eastern Iowa, as Dubuque got 2.16 inches, Cedar Rapids got 2.35 inches and Iowa City was hit with 3.47 inches.

Most impressively, the sea-level pressure (SLP) dropped to 989 millibars on Tuesday night — the lowest June SLP ever recorded in Madison. Green Bay’s SLP dropped to 986 — its record for June, breaking one set in 1917. As we have mentioned before in this column, differences in SLP are what drive the wind and so with this record low SLP, it is not surprising that wind gusts in Madison that night reached 30 mph at the airport and were likely higher in other local spots.

Dewpoint temperatures climbed into the low 70s overnight as well — a sure sign of tropical air. In fact, in the Janesville/Beloit area the overnight dewpoints were 75 degrees — more characteristic of Miami or New Orleans.

Though it is not the first time such a tropical system has affected the state, it is a rare event as various sources suggest no more than four other such events have occurred in recorded Wisconsin history.

Ed Hopkins, assistant state climatologist, informed us that the deadly Galveston Hurricane of September 1900 was one of the four. An unnamed hurricane from October 1949, Carla in 1961 and Gilbert in 1988 round out the rest of the storms that had impacted Wisconsin — though in each of these cases it was the southeastern corner of the state that was grazed.

Category: Meteorology, Seasons, Severe Weather

Comments Off on Was that a tropical storm last week?

How important were weather forecasts for D-Day?

U.S. troops come ashore in France on D-Day. (Photo credit: Associated Press archives)

Saturday marked the 76th anniversary of the Allied invasion of Europe and the beginning of the end for Nazi Germany.

The assault was enormous and relied on mobilization of a far-flung naval armada to deliver the necessary men and machines to the beaches at the appointed time.

In order to escape detection, a large number of ships involved in the invasion had to arrive from western Scotland and Wales and so had to start their ferries three or four days before the invasion began.

Those circumstances required the production of long-range weather forecasts contributed by three main agencies — the British Meteorological Office, U.S. Army Air Forces, and an amalgamated group at the Supreme Headquarters of the Allied Expeditionary Force.

As early as mid-February 1944, trial five-day forecasts were being made by a consensus of the three groups. At the time, the science of meteorology, and especially of weather forecasting, had not matured to the point where such long-range forecasts were really any better than guesses.

As the forecast window shortened to one to two days, the assembled experts were substantially better and more confident.

Late April and most of May were characterized by spectacular weather and the Germans fully expected the invasion would come then. As May turned to June, the weather turned for the worse.

With the original date of June 5 postponed due to an intense cyclone in the English Channel (it would end up being the region’s most intense June cyclone of the 20th century), slight improvement was foreseen for Tuesday morning, June 6, and the rest is history.

While riding to the Capitol on his inauguration day in 1961, President John F. Kennedy asked President Dwight D. Eisenhower why the Normandy invasion had been so successful.

Eisenhower answered, “Because we had better meteorologists than the Germans.”

Category: Meteorology, Severe Weather

Comments Off on How important were weather forecasts for D-Day?

When is hurricane season?

Hurricane Arthur off the east coast of the United States on May 18, 2020. (Photo credit: NOAA)

The peak of hurricane activity in the tropical waters south and southeast of the United States is typically in early to mid-September.

But hurricanes can occur any month of the year; the calendar isn’t the important thing — the ocean temperatures and the lack of wind shear are.

Hurricanes are large, whirling storms that obtain their energy from warm ocean waters and originate in the Atlantic basin, which includes the Atlantic Ocean, Caribbean Sea, Gulf of Mexico, and the eastern North Pacific Ocean.

All tropical storms form over warm waters. The evaporation of the warm ocean waters condenses to form clouds and precipitation releasing latent heat energy that helps to maintain the storm.

In general, hurricanes will not form unless the water temperature is at least 80 degrees.

Hurricane season carefully follows the seasonal cycle of ocean temperature. The Atlantic hurricane season officially starts June 1 and lasts until Nov. 30, which is the period when about 97% of hurricanes occur.

Hurricane Alex was declared a hurricane on Jan. 14, 2016, and maintained hurricane-force winds until Jan. 15. The Northern Atlantic Ocean is typically not 80 degrees in January.

Alex formed over waters whose temperatures were about 68 degrees, far below the norm. But the air high above was very cold, at minus 76 degrees. The 144-degree difference between the air and water temperature led to strong evaporation, helping to give the storm enough energy to become a hurricane.

An average hurricane season produces 12 named storms, of which six become hurricanes, including three major hurricanes.

An above-normal Atlantic hurricane season is expected this year. The 2020 seasonal forecast expects 13 to 19 named storms (winds of 39 mph or higher), of which six to 10 could become hurricanes (winds of 74 mph or higher), including three to six major hurricanes (with winds of 111 mph or higher).

The first hurricane of the 2020 season, Hurricane Arthur, took place May 16-19.

Category: Seasons, Severe Weather, Tropical

Comments Off on When is hurricane season?

Why is Memorial Day weather so fickle?

Joe and Heather Shilts, of Madison, wear headgear to shield themselves from the oppressive heat of the sun with temperatures in the 90s during the World’s Largest Brat Fest over the 2018 Memorial Day weekend. Due to the COVID-19 pandemic, A Virtual Brat Fest is taking place this year at www.bratfest.com. (Amber Arnold, State Journal archives)

Memorial Day weekend weather can be absolutely glorious in Wisconsin or it can be rainy and cold.

Perhaps no other major holiday suffers from such a Jekyll-and-Hyde split in our expectations, and there are really good scientific reasons that underlie this duality.

By the end of May the Northern Hemisphere is just about over the prior winter and the cold air that characterized it is almost completely left to very high latitudes where the longer days act quickly to erode what is left even near the Pole.

The process of “shedding” the cold air from winter sometimes involves the excursion southward of regional cold air vortices in the mid-troposphere, which meteorologists refer to as “cut off” low pressure systems.

If such a cut off low parks itself over the Great Lakes states, the weather is often persistently showery and chilly. This is because the air at about 3 miles above the ground is colder than normal in such a circumstance and, coupled with the relatively warm surface temperatures of late May, the atmosphere is made less stable and the threat of showery weather increases substantially.

These cut off lows can persist for several days in a row. It turns out that the seasonal maximum for such cut off lows over our area runs from mid-May to mid-June. Consequently, Memorial Day weekend can be plagued by the presence of one.

Category: Climate, Meteorology, Seasons

Comments Off on Why is Memorial Day weather so fickle?

What makes the weather?

Pierre Seguin, of Madison, encounters morning fog in Yahara Place Park along Lake Monona on a winter morning, an example of the fundamental cause of weather: the effect of the sun on Earth. (Photo credit: John Hart, WI State Journal archives)

The term “weather” refers to the temporary conditions of the atmosphere, the layer of air that surrounds Earth and is referenced to a particular location and moment.

The fundamental cause of weather is the effect of the sun on Earth. At any time, only half of Earth is warmed by the sun, while Earth’s other side is shadowed. This causes uneven heating of Earth’s surface by the sun every day, with some regions warmer than others.

These temperature differences cause weather: winds, clouds and precipitation. Seasonal weather patterns result from variations in temperature caused by Earth’s tilt toward the sun in summer and away from the sun in winter. The distribution of water and land, and the topography of the land, also contribute to the shaping of Earth’s weather patterns.

Six main variables describe weather: temperature, atmospheric pressure, wind, humidity, precipitation and cloudiness. Knowledge of how these variables change, through the action of atmospheric processes governed by the laws of physics, help forecasters to predict weather.

In the modern era, meteorologists also use computer-generated forecasts as a guide, and interpret that guidance using their knowledge of weather processes.

Weather at one location is often related to weather at other locations. So, an important part of studying and understanding the weather is seeing how observations of the atmosphere relate to each other geographically. A list of numbers doesn’t help much; we need a map.

Meteorologists represent weather at a particular location and time using the station model. This model is a clever method of representing many weather variables, including cloud cover and type, wind speed and direction, temperature, dew point temperature, visibility, precipitation type and intensity, atmospheric pressure, and the change in pressure over the last three hours in one visual. A weather map is filled with symbols indicating different types of weather systems.

Category: Meteorology, Seasons

Comments Off on What makes the weather?