What is the status of Earth’s ice?

The amount of ice covering Earth varies from year to year, but over a few decades, trends emerge.

A recent analysis of satellite observations from the European Space Agency clearly shows the amount of ice on earth is decreasing. Those measurements indicate that the amount of ice, in the form of ice sheets on land, mountain glaciers and sea ice, is decreasing.

The recent analysis of global satellite observations measured ice loss between 1994 and 2017 to be 31 trillion U.S. tons. That is equivalent to a sheet of ice 330-feet thick covering the state of Michigan.

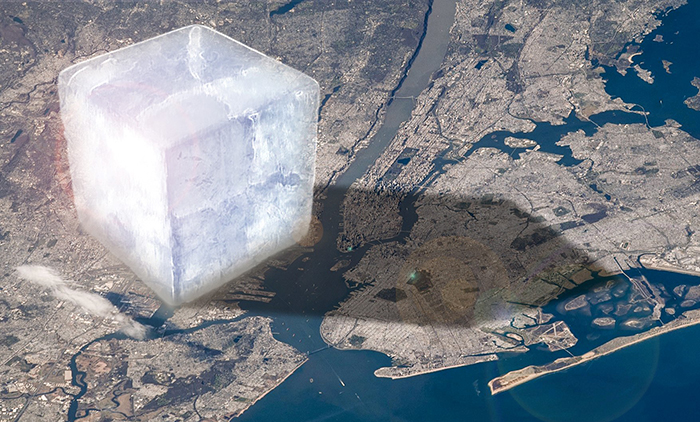
The rate at which Earth is losing ice is also increasing. In the 1990s, Earth lost about 0.9 trillion tons per year, and by 2017 Earth lost about 1.4 tons per year. For perspective, 1.1 trillion tons of ice is about the size of an ice cube measuring 6-by-6-by-6 miles. If placed in northern India, that ice cube would be taller than Mount Everest.

In perspective, one trillion tonnes of ice can be thought of as a cube of ice measuring 10x10x10 km, which would be taller than Mount Everest. Credit: ESA

During the survey period, there was a loss of 8.4 trillion tons of Arctic sea ice and a loss of 7.2 trillion tons from Antarctic ice sheets.

On land, losses include 6.7 trillion tons from mountain glaciers, 4.2 trillion tons from the Greenland ice sheet, and 2.6 trillion tons from the Antarctic ice sheet. The melting of ice on land contributes to a rise in the global mean sea-level. Many mountain glaciers are also a critical freshwater resource for local communities.

The global ice loss is attributed to a global warming of the atmosphere and oceans, which have warmed by 0.47 Fahrenheit and 0.22 F per decade since 1980, respectively.

Category: Climate, Meteorology

Comments Off on What is the status of Earth’s ice?

What is the “Ice Bowl”?

Fans at Lambeau Field watch the Green Bay Packers play the Dallas Cowboys in the NFL championship game Dec. 31, 1967, dubbed the “Ice Bowl.” The coldest game in NFL history saw temperatures of minus 12 to minus 14, with wind chills estimated to be 33 to 37 below zero.  (Photo credit: Associated Press archives)

The “Ice Bowl” refers to the National Football League’s championship game between the Green Bay Packers and the Dallas Cowboys that occurred on Dec. 31, 1967, at Lambeau Field in Green Bay.

The game was for the NFL title. The Packers entered the contest as the two-time defending NFL champions trying to become the first team in the league history to win three consecutive championships.

It was a great matchup between two strong football teams. The official game-time temperature was 13 degrees below zero. It was the first day of a cold stretch that lasted nine days. On seven of those nine days the temperature did not exceed zero.

The weather the day before had a high of 20 degrees. Just before midnight, an Arctic front ushered in bitter cold air.

During the game, temperatures ranged from minus 12 to minus 14, with wind chills estimated to be 33 to 37 below zero. It was, and remains, the coldest game in NFL history.

Despite the frigid temperature, more than 50,000 fans filled the stadium.

Prior to the start of the game, the football field froze. The field was covered with a tarp, but during the night a layer of condensation had built up between the field and the covering. When the tarp was removed, the field was exposed to the cold air and froze.

The Cowboys won the toss, and a reporter in the press box quipped, “Dallas won the toss and elected to go home.” The Packers won the game 21-17, driving 67 yards for the win, leaving 30 seconds remaining on the game clock. After the game, several players were treated for frostbite.

Now, over 40 years later, fans still have fond and frozen memories of that New Year’s Eve game.

Category: Seasons, Severe Weather, Weather Dangers

Comments Off on What is the “Ice Bowl”?

What is the weather like on Inauguration Day?

President Ronald Reagan, with first lady Nancy Reagan, gives a thumbs up to the crowd during his inaugural parade in Washington, D.C., on Jan. 20, 1981 — the warmest of all the January inaugurals with a high of 55 degrees. Reagan’s second inaugural on Jan. 20, 1985 was the coldest, with a noontime temperature of 6 degrees. (Photo credit: Associated Press)

Despite the fact that the presidential inauguration has moved from March 4 to Jan. 20 in the course of our history, on a number of occasions it has been strongly influenced by the weather.

Though many blamed the weather for sparking the fever that led to President William Henry Harrison’s death just 31 days into his term, this was almost certainly not the case. In fact, the noontime temperature on March 4, 1841, was 48 degrees with overcast skies and a stiff wind from the northwest.

President Abraham Lincoln’s second inaugural was sparsely attended — though his assassin, John Wilkes Booth, was there — because the day was rainy and cold with a temperature in the high 30s. President William Howard Taft was inaugurated in a blinding snowstorm on March 4, 1909 — a storm that Weather Bureau forecasters had, just a day before, dismissed as a minimal threat.

Since the date was moved in 1937, the average temperature on Inauguration Day has been lower, not surprisingly, as late January is the coldest time of the year.

A couple of the Jan. 20 inaugurations have been characterized by notable weather. In 1961, President John F. Kennedy was inaugurated the day after a powerful snowstorm covered Washington, D.C., with 8 inches of fresh snow on a sunny day when the temperature barely reached 20 degrees. In fact, his was the second-coldest Inauguration Day in history, topped only by President Ronald Reagan’s second inauguration on Jan. 20, 1985, when the noontime temperature was 6 degrees after a record-setting morning low of minus 2. As a result of the bitter cold, the inauguration took place in the Capitol Rotunda, and the parade was canceled. In contrast, Reagan’s first inaugural was the warmest of all the January inaugurals, enjoying a high of 55 degrees.

Steve Ackerman and Jonathan Martin, professors in the UW-Madison Department of Atmospheric and Oceanic Sciences, are guests on WHA radio (970 AM) at 11:45 a.m. the last Monday of each month.

Category: History

Comments Off on What is the weather like on Inauguration Day?

When was the use of computers for weather prediction first considered?

Shane Hubbard, a CIMSS researcher at the UW-Madison, is framed by computer monitors showing weather models at the university’s Atmospheric and Oceanic Sciences Building.  (Photo credit: John Hart, State Journal archives)

As we have opined a number of times before in this column, the development of numerical weather prediction (NWP) — the use of computers to mathematically produce weather forecasts — is one of the most unheralded scientific advances of the 20th century.

Coupled with the ubiquitous mobile phones we all use, this revolution has enabled us, at a glance, to get a sense of the coming weather days in advance.

It turns out that the first meeting ever convened to discuss the possibility of developing NWP took place just over 75 years ago, on Jan. 9, 1946, at the then-Weather Bureau’s headquarters less than a mile from the White House.

Present at this initial meeting was the chief of the Weather Bureau, Francis Reichelderfer, his top staff, a number of military meteorologists and the Princeton mathematician John von Neumann. Accompanying von Neumann to the meeting was Vladimir Zworykin, a physicist employed by RCA who had invented the scanning television camera. They had come to discuss their proposal to use the electronic digital computer von Neumann was then developing to not only forecast the weather, but also to control it.

As amazing as it sounds to us today, the original impetus for the development of NWP was to calculate where, and to what degree, nuclear explosions might be set off to alter the weather when destructive storms appeared on the forecast horizon. It was thought that this “intelligent” control of the weather would be rooted in reasonably accurate prediction of it for a couple of days in advance.

Fortunately, the evolving ethics of the nuclear age along with the extraordinary challenge presented by the originally secondary problem of providing computer-based forecasts quickly forced a humbler approach to this spectacular advance in weather prediction.

Category: History, Meteorology

Comments Off on When was the use of computers for weather prediction first considered?

How do ice crystals form and grow?

Snowflake photographed by Wilson Bentley

This question was considered by astronomer Johannes Kepler about 400 years ago.

Kepler published an article on the topic in 1611. He hypothesized that the crystals were made of subunits that combined to form the symmetrical shapes of ice crystals.

Perhaps the most well-known person to study ice crystals was Wilson A. Bentley, a Vermont farmer. He captured more than 5,000 exquisite photographs during his lifetime. His photographs document that ice crystals are all six-sided. Their beauty is echoed by the complexity of how they form and grow.

Physical chemistry explains the geometry. Ice crystals are made of water molecules, which are formed by two hydrogen atoms and one oxygen atom. The two hydrogen atoms form an angle of 104.5 degrees from the atomic nucleus. The oxygen atom attracts a larger share of electrons, making the water molecule slightly negative on one side and slightly positive on the other. When water freezes, the bipolar molecules are attracted to each other, forming a hexagonal crystal lattice.

When ice crystals form, water molecules cannot deposit onto the crystal haphazardly. The molecules must fit into the shape of the crystal.

The shape of a crystal is called its habit. As Bentley’s photographs captured, there are four basic habits of ice crystals: the hexagonal plate, the needle, the column and the dendrite.

Rime ice from freezing fog

Temperature and the vapor content of the environment determine the particular crystal habit. As the crystal moves through the atmosphere, the temperature and humidity change, which can change the growth habit, producing very complex shapes. The final shape of the crystal will vary according to environmental factors it experienced as it traversed the atmosphere.

Steve Ackerman and Jonathan Martin, professors in the UW-Madison Department of Atmospheric and Oceanic Sciences, are guests on WHA radio (970 AM) at 11:45 a.m. the last Monday of each month.

Category: Meteorology, Phenomena

Comments Off on How do ice crystals form and grow?