How dangerous is hot weather?

Hot weather can be dangerous, particularly if the humidity is high as well.

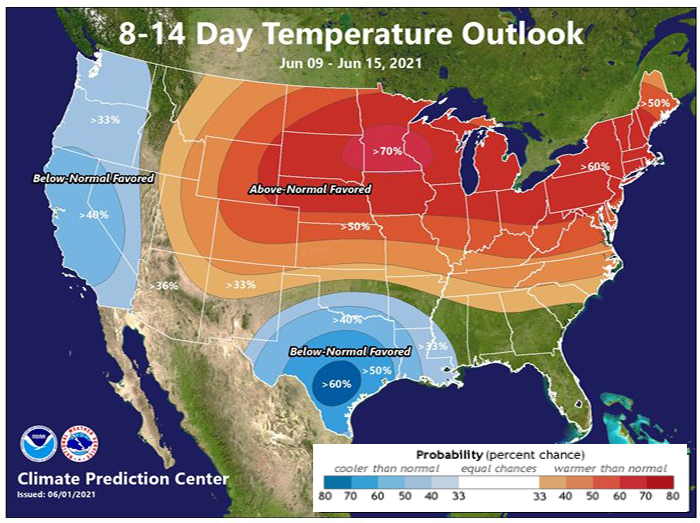
Much of the Upper Midwest had temperatures near or above 90 degrees over the weekend, except along the shorelines of the Great Lakes. Several locations set record high daily temperatures — in Madison, Saturday’s high of 92 degrees tied the record for the day set in 1934.

So it’s a good time to consider the dangers of hot weather, as extreme heat kills more people in the U.S. than any other type of weather event. According to the National Weather Service, an average of 130 people die in the U.S. from heat exposure each year.

Mid-June Temperature Outlook from NOAA’s Climate Predication Center

Perspiring is how a body cools down. Sweating, by itself, does not cool the body. It is the evaporation of sweat that cools the body.

At the same pressure and temperature, water evaporates more slowly in air that has a high relative humidity and more quickly in air that has a low relative humidity. This means that in high humidity, your body will cool at a slower rate, possibly creating a dangerous situation.

When the weather turns warm, it’s great to be active outside. But when it gets really hot and humid, be careful. As our muscles contract during exercise, our body produces heat; the harder you exercise, the greater the amount of heat your body needs to dissipate.

Exercising in high temperatures can cause heat cramps, heat exhaustion and potentially heat stroke. So, on hot days be sure to drink enough water or juices before, during and after exercise. Fluids help your body to perspire, which cools the skin via evaporation and keeps your body temperatures at a safe level.

Steve Ackerman and Jonathan Martin, professors in the UW-Madison Department of Atmospheric and Oceanic sciences, are guests on WHA radio (970 AM) at 11:45 a.m. the last Monday of each month and featured weekly in the Wisconsin State Journal.

Category: Meteorology, Seasons, Severe Weather

Comments Off on How dangerous is hot weather?

What is the prediction for the 2021 hurricane season?

Tropical cyclones are large, whirling storms that obtain their energy from warm ocean waters. Hurricanes are tropical cyclones that originate in the Atlantic Ocean, Caribbean Sea, Gulf of Mexico or the eastern North Pacific Ocean. Tropical storms have wind speeds between 39 and 73 mph, while hurricanes have wind speeds of greater than 74 mph. These storms form over warm waters. A general rule of thumb is that hurricanes will not form unless the water temperature is at least 80 degrees.

An average hurricane season produces 12 named storms, of which six become hurricanes, including three major hurricanes, with wind speeds greater than 111 mph.

An above-normal Atlantic hurricane season is expected this year. The National Oceanic and Atmospheric Administration prediction for 2021 is a likelihood of 13-20 named storms with sustained winds of at least 39 mph. Six to 10 of those are likely to become hurricanes, with winds of 74 mph or higher, including three to five major hurricanes.

Official 2021 Atlantic Hurricane Season Outlook from NOAA

The Atlantic hurricane season officially starts June 1 and lasts until Nov. 30. That is the time of year when most hurricanes occur — about 97% of them. But hurricanes can occur any month of the year. The calendar isn’t the important thing; the ocean temperatures and the lack of vertical wind shear are.

We already had our first named storm of the 2021 season. Tropical storm Ana formed on May 22, 10 days before the official start of the 2021 Atlantic hurricane season. This is the seventh consecutive year in which a tropical or subtropical cyclone formed before the official start of the season on June 1.

Steve Ackerman and Jonathan Martin, professors in the UW-Madison Department of Atmospheric and Oceanic Sciences, are guests on WHA radio (970 AM) at 11:45 a.m. the last Monday of each month

Category: Meteorology, Seasons, Tropical

Comments Off on What is the prediction for the 2021 hurricane season?

Where does water exist?

GOES East satellite image showing global water vapor. Values measured are temperature but colors also indicate moisture in the atmosphere where greens and blues reveal high water vapor content and yellows and orange indicates dry air.

Evidence of the presence of water in our atmosphere is ubiquitous.

Water occurs in the Earth’s atmosphere in all three of its phases — solid (snow and ice), liquid (rain and dew) and gas (invisible water vapor). As we begin to emerge from the recent cool spell and really enter spring/summer, we may begin to see more dew on the ground and on the windshields of cars in the morning.

The air nearly always holds some amount of water vapor. Dew is liquid water that condenses overnight onto objects when the air that contains the water vapor cools to a sufficiently low temperature.

One of the important and microscopic characteristics of the condensation process is that water vapor will not condense into liquid water very easily unless it condenses onto a foreign object such as the tiny hairlike structures on grasses or dust and pollen particles on windshields. In fact, on particularly dewy mornings, if you wait for the dew to evaporate you may find yellow stains on your windshield that are left as the liquid water evaporates, leaving the pollen particles on which it originally condensed.

The formation of raindrops requires a similar collection of foreign objects upon which water vapor can condense. Such objects are known as cloud condensation nuclei, and a great number of naturally occurring substances can serve this role, including dust particles, smoke particles, salt particles, pollen grains, particulate matter from smokestacks, and naturally occurring aerosol particles.

Without these cloud condensation nuclei, the formation of cloud liquid water droplets, and eventually precipitation-sized particles (which are 1 million times more voluminous), would be considerably more difficult in our atmosphere.

In that case, rain and snow would be rare occurrences and life on the planet would be put at risk.

Steve Ackerman and Jonathan Martin, professors in the UW-Madison department of atmospheric and oceanic sciences, are guests on WHA radio (970 AM) at 11:45 a.m. the last Monday of each month. Send them your questions at stevea@ssec.wisc.edu or jemarti1@wisc.edu.

Category: Climate, Meteorology, Seasons

Comments Off on Where does water exist?

How unusual was this cold first half of May?

Tulips bloom around the Wisconsin state Capitol during eight straight chilly May mornings with overnight lows in the 30s.
(Credit: Ruthie Hauge, The Capital Times)

The first two days of this month had high temperatures of 87 and 84, respectively, and daily average temperatures (the average of the daily high and daily low) that were 15 and 19 degrees above normal.

In the next 12 days, the daily average temperature has been just shy of 6 degrees below normal. In fact, during that nearly two week stretch, nine days have had overnight lows in the 30s, including a streak of eight straight days from May 7 through Friday. The morning low on Tuesday was 30 degrees — notably cold and memorable for most of us, but only the 61st coldest morning in the first half of May in Madison’s history, far behind the all-time lowest of 19 degrees recorded on May 1, 1978.

However, the streak of cold mornings we have just endured is much more unusual. In fact, only four eight-day streaks of early May mornings with a low temperature at or below 39 degrees have occurred in Madison history — in 1971, 1976, 1989 and this month.

During this unusual spell of persistent cold nights, we have also been falling behind in precipitation. For the month of May, we are already 0.92 inches below normal and we are only halfway through the month. Coupled with our unusually dry April (and dry winter months of December-March) we are currently running 5.21 inches below normal in precipitation since December 1.

That is a substantial deficit which will require excessive late spring and summer rains to remedy. So, with the near-certain approach of warmer weather, attention to our accrued water deficit will become more urgent.

Steve Ackerman and Jonathan Martin, professors in the UW-Madison department of atmospheric and oceanic sciences, are guests on WHA radio (970 AM) at 11:45 a.m. the last Monday of each month. Send them your questions at stevea@ssec.wisc.edu or jemarti1@wisc.edu.

Category: Meteorology, Seasons

Comments Off on How unusual was this cold first half of May?

Why do we have a new normal in weather?

Image credit: NCEI and NOAA Climate.gov

The National Ocean and Atmosphere Administration’s National Climatic Data Center (or NCDC) calculates the average weather conditions over a 30-year period for more than 7,500 locations in the United States.

A reliable estimate of an average requires at least 30 years. These 30-year averages are referred to as the U.S. Climate Normal. They provide a baseline that allows everyone to compare a location’s current weather to the average weather that location would expect to see — whether a particular day’s temperature is cooler or warmer than normal, or if a particular month is wetter than normal.

Revised normals are computed every decade to account for the most recent 30 years of climate change. Over the past decade, the normals have been based on weather observations from 1981 to 2010. In early May, climate experts at NOAA issued an updated collection based on the weather occurring from 1991 to 2020.

Scientists use the 20th-century average (1901-2000) to examine long-term climate trends. If we compare the 1991-2020 annual temperature normals to the 20th-century average, we see warming occurring across the U.S. No region is cooler in the past 30 years than it was during the 20th century. The nation’s midsection — from the Gulf of Mexico to the Great Lakes — did not warm as much as other parts of the country but saw a 5% to 15% increase in precipitation over the 20th-century average.

The new climate normals for Madison are warmer, wetter and snowier. The annual precipitation for Madison increased almost 3 inches, and the annual snowfall increased almost an inch. The average annual temperature went from 46.5 degrees to 47 degrees. Each season is warmer and wetter as well.

Steve Ackerman and Jonathan Martin, professors in the UW-Madison department of atmospheric and oceanic sciences, are guests on WHA radio (970 AM) at 11:45 a.m. the last Monday of each month. Send them your questions at stevea@ssec.wisc.edu or jemarti1@wisc.edu.

Category: Climate, History

Comments Off on Why do we have a new normal in weather?