How are we doing for snowfall this season?

Precipitation forecast for March 2022 (Image credit: Climate Prediction Center, NOAA/NCEP)

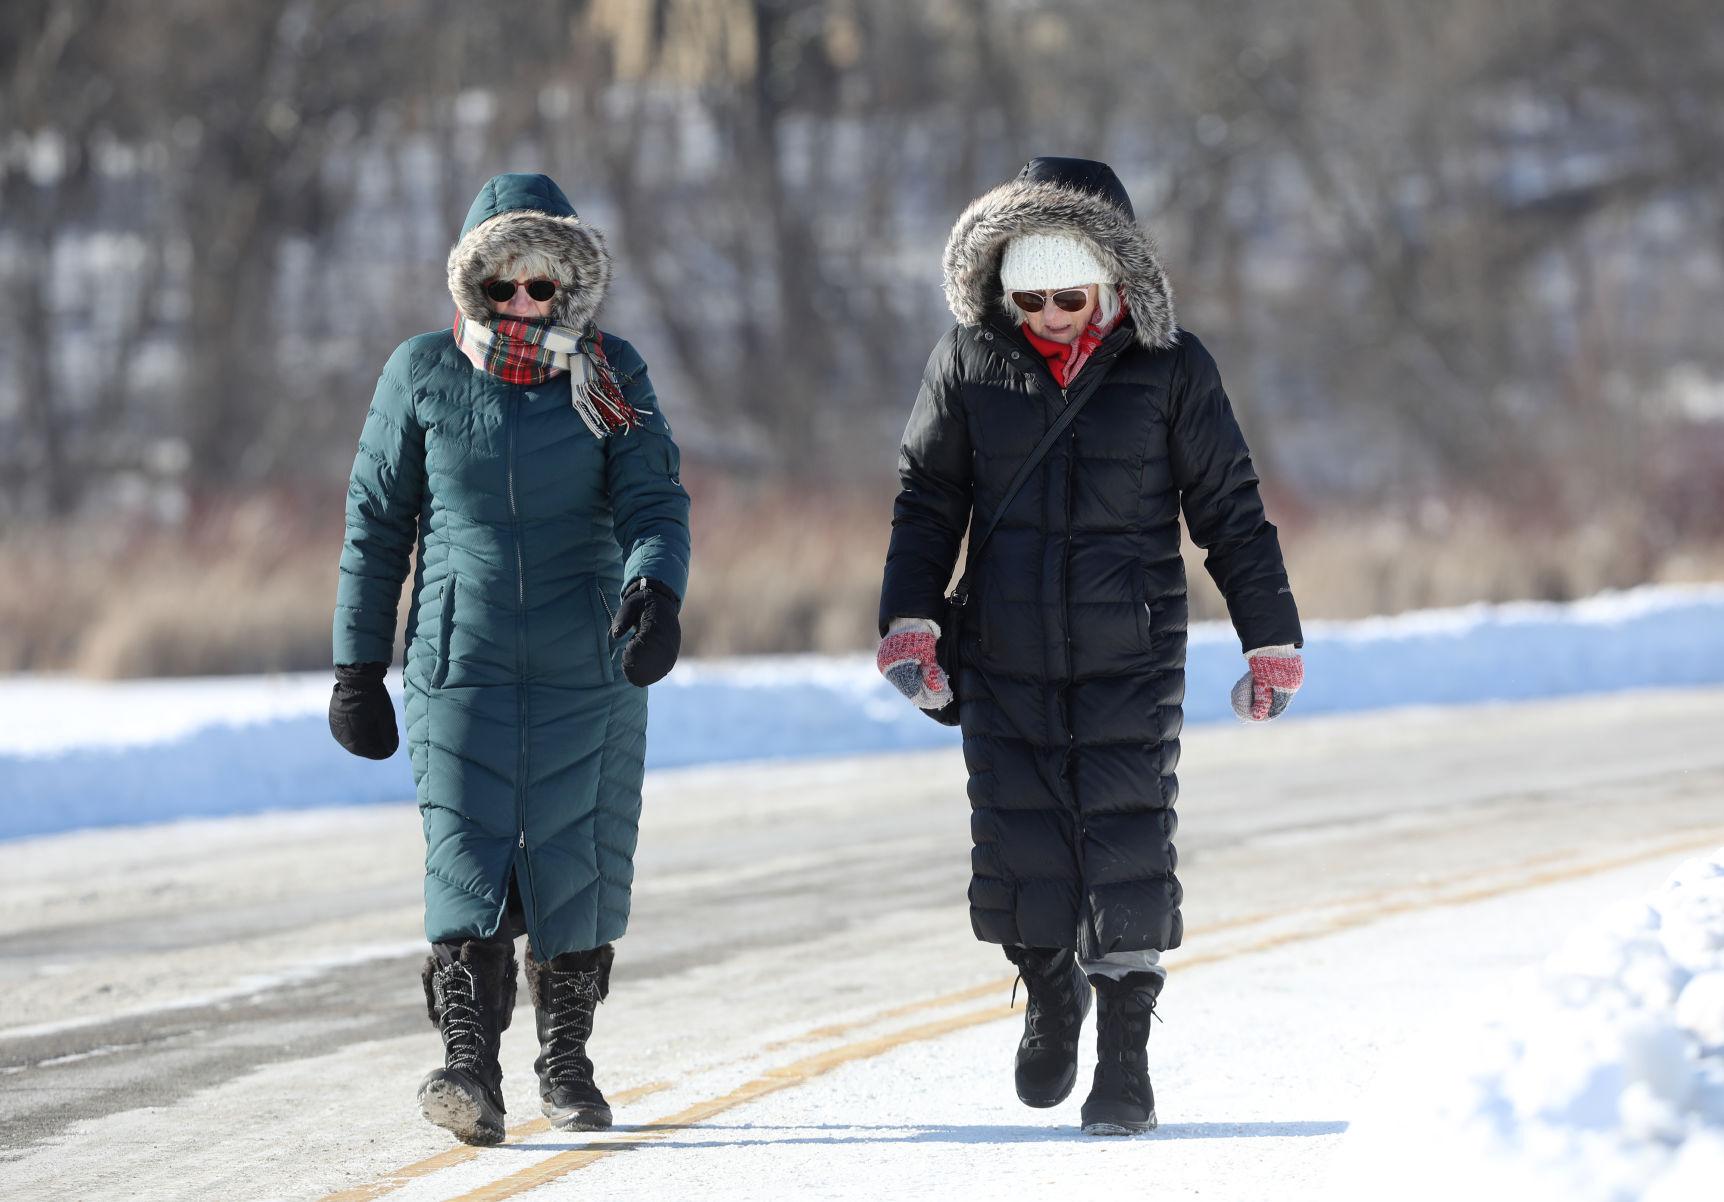
Despite the persistence of snow and ice on the ground this winter, since our first real covering appeared just after Christmas Day, it has been a remarkably snowless winter thus far.

After Thursday night’s 2.7-inch snowfall, the season total for Madison rose to a paltry 21.4 inches, which places us well behind the average for the season to this point, which is 41.3 inches.

Just how unusual is this amount?

It turns out that about 25% of the time a winter season accumulates less than 30 inches of snow in Madison. In 138 seasons, dating back to 1884-85, Madison has had only 33 winters in which the total snowfall remained below that threshold — the last one of those was 2002-03, when only 28.8 inches accumulated.

Thirteen seasons have received less than 25 inches of snow, the last one being 1967-68, when only 12.7 inches fell. That season was the most recent of only five seasons in which less than 20 inches of snow fell in a season — the other four were 1933-34, 1913-14, 1901-02 and 1894-95. Of those five, the all-time least snowy winter was 1901-02 when, unbelievably, only 4 inches accumulated for the season.

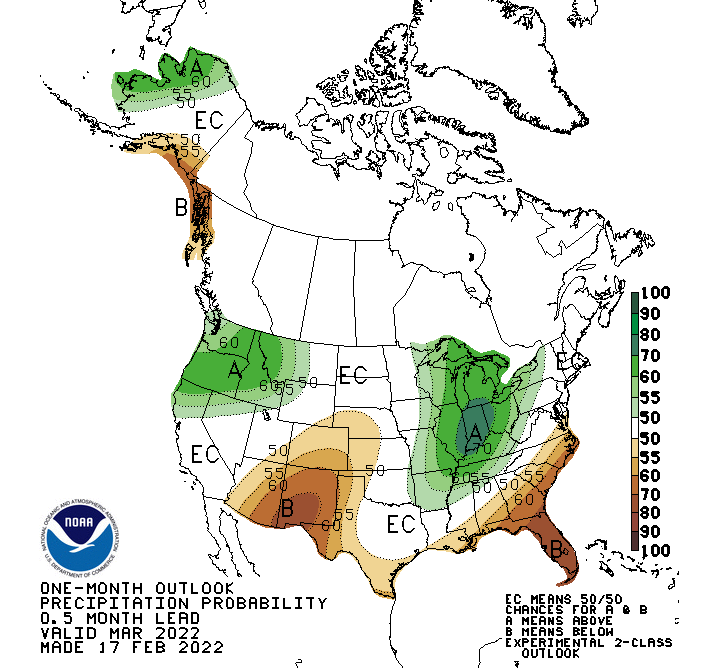
Since 7 inches of snow falls in Madison in an average March, we will have to have a snowier than normal March to move past 30 inches of snow for this season.

Though it is subject to substantial revision, the forecast for the coming first two weeks of March does suggest the possibility of a couple of sizable snowfalls that just might rescue us from landing on this list of exceptionally boring winters.

Steve Ackerman and Jonathan Martin, professors in the UW-Madison department of atmospheric and oceanic sciences, are guests on WHA radio (970 AM) at 11:45 a.m. the last Monday of each month. Send them your questions at stevea@ssec.wisc.edu or jemarti1@wisc.edu.

Category: Climate, Meteorology, Seasons

Comments Off on How are we doing for snowfall this season?

How did the Tonga eruption affect the atmosphere?

Hunga Tonga erupted on Jan. 15 and lasted 11 hours.

JMA Himawari-8 True Color RGB image showed the rapid expansion of a volcanic cloud following an explosive eruption of Hunga Tonga on 15 January 2022. An abrupt shock wave was also evident, which propagated radially outward in all directions. (Photo credit: CIMSS Satellite Blog)

It devastated the region, covering the land in a layer of ash. The eruption blasted a plume of ash and water vapor 34 miles into the atmosphere — into the mesosphere.

The Hunga Tonga plume contained only a very small amount of sulfur dioxide (SO2). Sulfur dioxide from volcanic mega-eruptions that reach high in the atmosphere can have an impact on global temperature. The mega-eruption of Pinatubo in 1991 released enough sulfur dioxide to cool the Earth’s surface for three years. The Tonga eruption will not have that kind of impact.

Lightning is common with volcanic eruptions. The turbulence in the eruption plume makes particles of ash and water collide to rub together, generating electrical charges that lead to lightning. Hunga Tonga was no exception, producing nearly 400,000 lightning strikes.

The shockwave from the eruption caused an atmospheric pressure wave that traveled around the globe. It was measured at weather stations around the world. The pressure wave circumnavigated the globe at nearly 700 mph. Associated with the pressure wave were short-lived upward motions that generated thin clouds observed at Hawaii. Satellite observations measured temperature fluctuations in the upper troposphere and lower stratosphere that accompanied the pressure wave.

The atmospheric pressure wave also pushed water all the way to Puerto Rico. This resulting wave, measuring about 4 inches in height, resulted from the atmospheric pressure wave and is referred to as a meteotsunami. Tsunamis are triggered by seismic activity; water waves driven by air pressure disturbances are called meteotsunamis.

Steve Ackerman and Jonathan Martin, professors in the UW-Madison department of atmospheric and oceanic sciences, are guests on WHA radio (970 AM) at 11:45 a.m. the last Monday of each month. Send them your questions at stevea@ssec.wisc.edu or jemarti1@wisc.edu.

Category: Climate, Phenomena

Comments Off on How did the Tonga eruption affect the atmosphere?

When was the National Weather Service created?

President Ulysses S. Grant — who signed a law on February 9, 1870 that resulted in the National Weather Service. (Photo credit: Library of Congress)

While successfully prosecuting the Civil War against the Confederacy, Gen. Ulysses S. Grant had learned that weather information — even if not in the form of a forecast — was extremely valuable for operations.

Then, in the years after the war, Dr. Increase Lapham, a Milwaukee scientist, lobbied Milwaukee’s congressman, Gen. Halbert Paine, to push for the establishment of a storm warning service for the Great Lakes. On Feb. 2, 1870, Paine introduced a Joint Congressional Resolution requiring the Secretary of War “to provide for taking meteorological observations at the military stations in the interior of the continent, and at other points in the States and Territories … and for giving notice on the northern lakes and on the seacoast, by magnetic telegraph and marine signals, of the approach and force of storms.”

On Feb. 9, 1870 — 152 years ago last week — a sympathetic President Ulysses S. Grant signed the resolution into law and what is now known as the National Weather Service was born. Thus, the service began its life within the U.S. Army Signal Service’s Division of Telegrams and Reports for the Benefit of Commerce.

Observations officially began on Nov. 1, 1870. Exactly a week later, on Nov. 8, Lapham issued the service’s first storm warning on the approach of a storm over Lake Michigan.

On Oct. 1, 1890, at the request of President Benjamin Harrison, Congress passed a law transferring the meteorological responsibilities of the Signal Service to the newly created U.S. Weather Bureau, which was housed in the Department of Agriculture. The Weather Bureau became the National Weather Service in 1970 with the creation of the National Oceanic and Atmospheric Administration, or NOAA.

Steve Ackerman and Jonathan Martin, professors in the UW-Madison department of atmospheric and oceanic sciences, are guests on WHA radio (970 AM) at 11:45 a.m. the last Monday of each month. Send them your questions at stevea@ssec.wisc.edu or jemarti1@wisc.edu.

Category: History, Meteorology

Comments Off on When was the National Weather Service created?

Do you read the “Farmer’s Almanac” for weather forecasts?

“The Old Farmer’s Almanac” has been published since 1792. It doesn’t share how it makes its weather forecast, so it can’t be judged scientifically.
(Photo credit: State Journal archives)

No, not seriously.

There are two publications of a “farmer’s almanac.” “The Old Farmer’s Almanac” has been in publication since 1792. Then there’s the “Farmers’ Almanac,” which has been in publication since 1818.

Both publications contain what is typical of almanacs in general — planting dates, tide tables, various astronomical and astrological information, content typically contained in almanacs. They also offer gardening tips as well as jokes and whimsical columns. These two publications also predict the general weather for the coming year.

Before modern meteorology, almanacs were one of the only ways in which people would receive weather predictions. Our great-great-grandparents probably read the almanac predictions. But we have come a long way in understanding the physics of the atmosphere since the 19th century.

Are the predictions accurate? Rigorous comparison to local or National Weather Service forecasts are difficult. Much like a horoscope, the almanacs’ predictions are as vague as possible so that the forecast can be interpreted as true if you want it to be so.

The method of how the almanacs make a forecast remains a secret and thus cannot be assessed. We suggest you follow the modern forecast methods instead.

Steve Ackerman and Jonathan Martin, professors in the UW-Madison department of atmospheric and oceanic sciences, are guests on WHA radio (970 AM) at 11:45 a.m. the last Monday of each month. Send them your questions at stevea@ssec.wisc.edu or jemarti1@wisc.edu.

Category: History, Seasons

Comments Off on Do you read the “Farmer’s Almanac” for weather forecasts?

How did it ever get so cold on Jan. 30, 1951?

Despite Wednesday’s frigid temperatures, longtime friends Jane Ferris, left, and Avirl Hanson, both of Madison, go for their weekly walk along Vilas Park Drive. (Photo credit: Amber Arnold, State Journal)

On the morning of Jan. 30, 1951, the temperature in Madison fell to its all-time record low of minus 37 degrees.

It is difficult to put that amazing record low in perspective. Consider that the coldest morning of this winter season was less than a week ago, when the temperature Wednesday dropped to minus 18 — a full 19 degrees warmer than the all-time record.

The only other time a low temperature as cold as minus 30 occurred in Madison was on Jan. 15, 1963 — exactly minus 30 — nearly 60 years ago. Lows of minus 29 occurred on Jan. 7, 1887, and again on Jan. 21, 1888. Forty-three years ago, on Jan. 11 and again on Jan. 16, 1979, Madisonians awoke to a low of minus 28. More recently, we had three straight days of morning lows at minus 27 on Jan. 18, 19 and 20, 1994, and just three years ago this morning we fell to minus 26.

How did this freakishly low record ever occur in the first place? It required a perfectly aligned set of circumstances:

First, fresh snow cover — not hard to come by in January — that allows the air just above the snow to radiate enormous amounts of heat away from the snow surface over the course of the still long nights of late January.

Second, very light winds such as those that routinely accompany the center of surface high pressure systems. Such light winds ensure that warmer air above the surface is not mixed down to the surface.

Third, rapid export of the cold air from more northern latitudes that ensures the air’s temperature does not moderate on its way to Madison.

These ingredients needed to occur in perfect coordination with each other to get down to minus 37. Given the record value, these circumstances occurred with a level of coordination that had never before (or since) occurred in Madison’s 150-year temperature history.

Given the gradual but systematic global warming that is irrefutably occurring at present, perfect conspiracies of these meteorological circumstances — which will still occasionally occur — will henceforth be fighting a headwind they cannot beat. Thus, it is reasonable to suspect that minus 37 degrees will probably be the all-time record forever.

Steve Ackerman and Jonathan Martin, professors in the UW-Madison department of atmospheric and oceanic sciences, are guests on WHA radio (970 AM) at 11:45 a.m. the last Monday of each month. Send them your questions at stevea@ssec.wisc.edu or jemarti1@wisc.edu.

Category: History, Seasons, Severe Weather

Comments Off on How did it ever get so cold on Jan. 30, 1951?