When was the National Weather Service created?

President Ulysses S. Grant — who signed a law on February 9, 1870 that resulted in the National Weather Service. (Photo credit: Library of Congress)

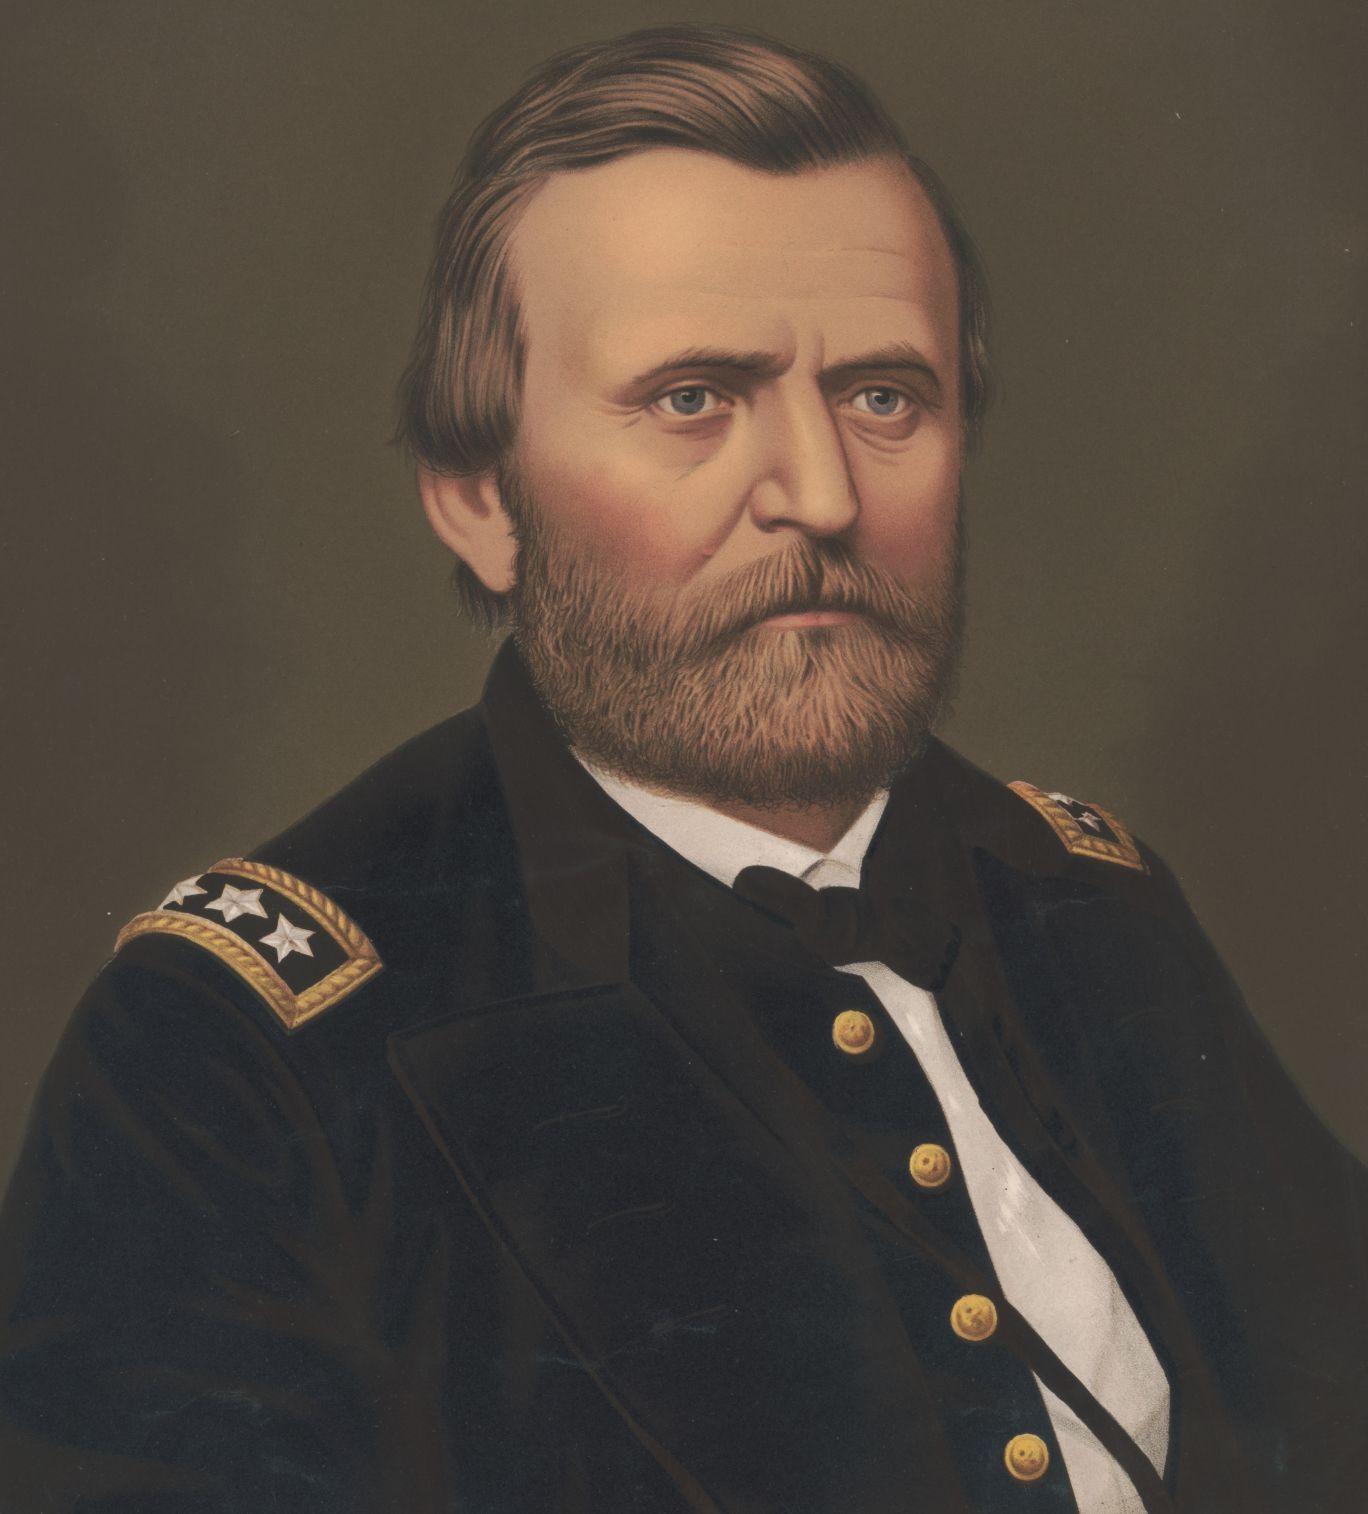
While successfully prosecuting the Civil War against the Confederacy, Gen. Ulysses S. Grant had learned that weather information — even if not in the form of a forecast — was extremely valuable for operations.

Then, in the years after the war, Dr. Increase Lapham, a Milwaukee scientist, lobbied Milwaukee’s congressman, Gen. Halbert Paine, to push for the establishment of a storm warning service for the Great Lakes. On Feb. 2, 1870, Paine introduced a Joint Congressional Resolution requiring the Secretary of War “to provide for taking meteorological observations at the military stations in the interior of the continent, and at other points in the States and Territories … and for giving notice on the northern lakes and on the seacoast, by magnetic telegraph and marine signals, of the approach and force of storms.”

On Feb. 9, 1870 — 152 years ago last week — a sympathetic President Ulysses S. Grant signed the resolution into law and what is now known as the National Weather Service was born. Thus, the service began its life within the U.S. Army Signal Service’s Division of Telegrams and Reports for the Benefit of Commerce.

Observations officially began on Nov. 1, 1870. Exactly a week later, on Nov. 8, Lapham issued the service’s first storm warning on the approach of a storm over Lake Michigan.

On Oct. 1, 1890, at the request of President Benjamin Harrison, Congress passed a law transferring the meteorological responsibilities of the Signal Service to the newly created U.S. Weather Bureau, which was housed in the Department of Agriculture. The Weather Bureau became the National Weather Service in 1970 with the creation of the National Oceanic and Atmospheric Administration, or NOAA.

Steve Ackerman and Jonathan Martin, professors in the UW-Madison department of atmospheric and oceanic sciences, are guests on WHA radio (970 AM) at 11:45 a.m. the last Monday of each month. Send them your questions at stevea@ssec.wisc.edu or jemarti1@wisc.edu.

Category: History, Meteorology

Comments Off on When was the National Weather Service created?

Do you read the “Farmer’s Almanac” for weather forecasts?

“The Old Farmer’s Almanac” has been published since 1792. It doesn’t share how it makes its weather forecast, so it can’t be judged scientifically.
(Photo credit: State Journal archives)

No, not seriously.

There are two publications of a “farmer’s almanac.” “The Old Farmer’s Almanac” has been in publication since 1792. Then there’s the “Farmers’ Almanac,” which has been in publication since 1818.

Both publications contain what is typical of almanacs in general — planting dates, tide tables, various astronomical and astrological information, content typically contained in almanacs. They also offer gardening tips as well as jokes and whimsical columns. These two publications also predict the general weather for the coming year.

Before modern meteorology, almanacs were one of the only ways in which people would receive weather predictions. Our great-great-grandparents probably read the almanac predictions. But we have come a long way in understanding the physics of the atmosphere since the 19th century.

Are the predictions accurate? Rigorous comparison to local or National Weather Service forecasts are difficult. Much like a horoscope, the almanacs’ predictions are as vague as possible so that the forecast can be interpreted as true if you want it to be so.

The method of how the almanacs make a forecast remains a secret and thus cannot be assessed. We suggest you follow the modern forecast methods instead.

Steve Ackerman and Jonathan Martin, professors in the UW-Madison department of atmospheric and oceanic sciences, are guests on WHA radio (970 AM) at 11:45 a.m. the last Monday of each month. Send them your questions at stevea@ssec.wisc.edu or jemarti1@wisc.edu.

Category: History, Seasons

Comments Off on Do you read the “Farmer’s Almanac” for weather forecasts?

How did it ever get so cold on Jan. 30, 1951?

Despite Wednesday’s frigid temperatures, longtime friends Jane Ferris, left, and Avirl Hanson, both of Madison, go for their weekly walk along Vilas Park Drive. (Photo credit: Amber Arnold, State Journal)

On the morning of Jan. 30, 1951, the temperature in Madison fell to its all-time record low of minus 37 degrees.

It is difficult to put that amazing record low in perspective. Consider that the coldest morning of this winter season was less than a week ago, when the temperature Wednesday dropped to minus 18 — a full 19 degrees warmer than the all-time record.

The only other time a low temperature as cold as minus 30 occurred in Madison was on Jan. 15, 1963 — exactly minus 30 — nearly 60 years ago. Lows of minus 29 occurred on Jan. 7, 1887, and again on Jan. 21, 1888. Forty-three years ago, on Jan. 11 and again on Jan. 16, 1979, Madisonians awoke to a low of minus 28. More recently, we had three straight days of morning lows at minus 27 on Jan. 18, 19 and 20, 1994, and just three years ago this morning we fell to minus 26.

How did this freakishly low record ever occur in the first place? It required a perfectly aligned set of circumstances:

First, fresh snow cover — not hard to come by in January — that allows the air just above the snow to radiate enormous amounts of heat away from the snow surface over the course of the still long nights of late January.

Second, very light winds such as those that routinely accompany the center of surface high pressure systems. Such light winds ensure that warmer air above the surface is not mixed down to the surface.

Third, rapid export of the cold air from more northern latitudes that ensures the air’s temperature does not moderate on its way to Madison.

These ingredients needed to occur in perfect coordination with each other to get down to minus 37. Given the record value, these circumstances occurred with a level of coordination that had never before (or since) occurred in Madison’s 150-year temperature history.

Given the gradual but systematic global warming that is irrefutably occurring at present, perfect conspiracies of these meteorological circumstances — which will still occasionally occur — will henceforth be fighting a headwind they cannot beat. Thus, it is reasonable to suspect that minus 37 degrees will probably be the all-time record forever.

Steve Ackerman and Jonathan Martin, professors in the UW-Madison department of atmospheric and oceanic sciences, are guests on WHA radio (970 AM) at 11:45 a.m. the last Monday of each month. Send them your questions at stevea@ssec.wisc.edu or jemarti1@wisc.edu.

Category: History, Seasons, Severe Weather

Comments Off on How did it ever get so cold on Jan. 30, 1951?

Why does my home seem so dry in cold weather?

The amount of moisture in the air, which is the humidity, is a very important aspect of weather.

There are a few ways to express the amount of water vapor in the atmosphere. Each way has advantages and disadvantages. Two of the more common are the dew point and the relative humidity.

The dew point is the temperature to which air must be cooled to become saturated with water vapor, assuming constant air pressure and water content. Dew forms when air is cooled to the dew point temperature.

Try online activity explaining the relationship between the thermostat setting in your house and the outdoor temperature and dew point: go.madison.com/dewpoint

The relative humidity is a percentage, defined as the ratio of the actual amount of water vapor in the air to the maximum amount of water vapor the air can hold. The maximum amount is a function of temperature. When the dew point temperature equals the air temperature, the relative humidity is 100% and the air is considered saturated with water vapor. The larger the difference between the dew point and the temperature, the lower the relative humidity. Cold outside air entering your home is heated by your furnace; this increases the temperature but not the dew point. This leads to a drop in relative humidity in your house, as the difference between the dew point temperature and the temperature in your home increases. If you want to explore this relationship between the thermostat setting in your house and the outdoor temperature and dew point, try this on-line activity at go.madison.com/dewpoint.

When the dew point is too low, your skin may dry out and feel itchy. Also, static electricity in your home may increase. This can cause clothes to stick together and for you to feel shocks when you touch something. Humidifiers add water molecules to the air, which increases the dew point temperature. That can result in a higher relative humidity.

Steve Ackerman and Jonathan Martin, professors in the UW-Madison department of atmospheric and oceanic sciences, are guests on WHA radio (970 AM) at 11:45 a.m. the last Monday of each month. Send them your questions at stevea@ssec.wisc.edu or jemarti1@wisc.edu.

Category: Meteorology, Seasons

Comments Off on Why does my home seem so dry in cold weather?

How does this winter measure up so far?

NOAA’s Climate Prediction Center’s 3-month outlook depicting the most likely temperature outcome. (Credit: NOAA/CPC)

Two of the more popular (and telling) measures of the severity of a winter are extremes of cold and the presence of snow.

One reasonable way to consider extremes of cold might be to count the number of mornings on which the temperature drops below zero. So far this winter (defined as beginning on Dec. 1), we have had just five such mornings here in Madison.

It turns out, over the last 30 winters (back to 1992-93), Madison has averaged 5.97 such mornings through Jan. 17. So, it might seem that we are pretty normal by this measure, though the variability of below-zero mornings is quite large.

Six of the last 30 years have had no such days, while five have had 13 or more — the winner is 2000-01, when 19 such frosty mornings graced Madison, 14 of them in an incredibly wintry December.

However, our average temperature since Dec. 1 is about 2.7 degrees above average — quite warm for the first half of meteorological winter. Our snow situation has been unimpressive so far, as we have had only two days on which 1 inch or more of snow has fallen. The biggest snowfall occurred on Dec. 28, when 3.3 inches fell, and our snow depth has varied between 3 and 4 inches ever since, accounting for the wintry look we have all experienced for the past two weeks plus.

With only a couple of rather light snows in the forecast for the next couple of weeks — though that is subject to change — our snow situation might remain paltry through the end of January. So far, not a very memorable winter.

Steve Ackerman and Jonathan Martin, professors in the UW-Madison department of atmospheric and oceanic sciences, are guests on WHA radio (970 AM) at 11:45 a.m. the last Monday of each month. Send them your questions at stevea@ssec.wisc.edu or jemarti1@wisc.edu.

Category: Climate, Meteorology, Seasons

Comments Off on How does this winter measure up so far?