
The National Weather Service is responsible for issuing forecasts, watches and warnings for a variety of weather and water hazards. A “warning” is issued when hazardous weather poses an immediate threat to life or property.
A warning can be issued for a variety of hazardous weather, including tornadoes, thunderstorms and flash floods. These threats can form quickly, last a few minutes and impact a small area. Forecasters must rely heavily on observational data from Doppler radar, satellite, and other ground-based equipment and sensors to inform them during the warning process.
Hazardous weather also occurs on a larger scale and are slower evolving, such as low-pressure systems that produce ice storms. In these cases, forecasters use numerical weather models and statistical analysis to come up with a most likely forecast. The forecaster studies the data to determine the need to issue a warning. Once forecasters have high enough confidence there will be significant impacts, a warning is issued as far in advance as possible. The warning covers areas that are expected to see hazardous weather.
The broad reliance on the NWS is a good thing, as publicly accessible data that is standardized and updated regularly helps ensure accuracy of the forecasts.
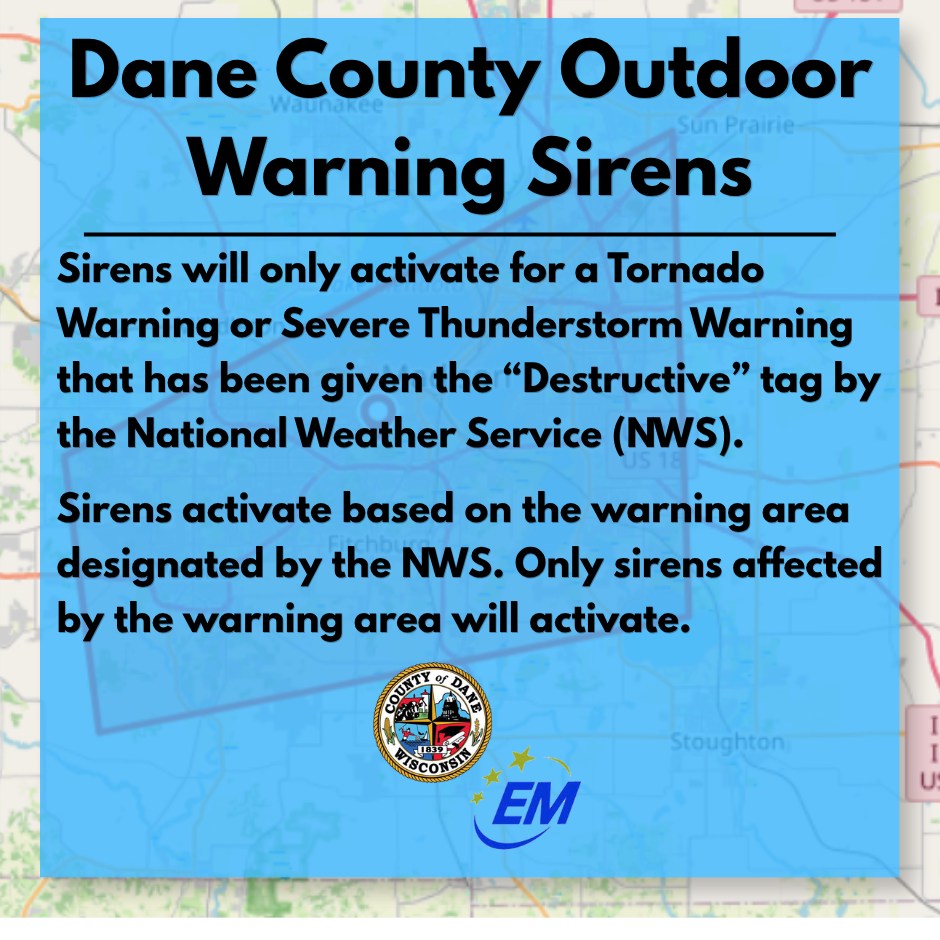
Sirens are typically activated by city or county officials, usually a police or fire department or emergency management personnel. Individual counties’ emergency management teams or local municipalities own the sirens. The NWS will indicate where and when a tornado warning is in effect, and the local dispatch centers active the sirens. Each county uses its sirens differently. Some will sound sirens across the entire county. Other will only activate sirens within the warned area.
Steve Ackerman and Jonathan Martin, professors in the UW-Madison department of atmospheric and oceanic sciences, are guests on WHA radio (970 AM) at noon the last Monday of each month. Send them your questions at stevea@ssec.wisc.edu or jemarti1@wisc.edu.


