
Last year we experienced a persistently cold winter (December-January-February) that ended up being the coldest since 1979.
This year has been different. The Midwest Regional Climate Center is experimenting with what they are calling the Accumulated Winter Season Severity Index (AWSSI), which incorporates temperature, snowfall and snow depth to rate the severity of winter.
Through Feb. 11, we are having a slightly colder than average winter locally.
Interestingly, it has been a remarkably “warm” winter when considered from the hemispheric perspective.
Four times each day we calculate the areal extent of air colder than minus 5 degrees Celsius (23 degrees Fahrenheit) 1 mile above the surface using weather data (not forecasts) supplied by the National Center for Environmental Prediction. Averaging the four measurements per day together creates a daily value of the areal extent of this cold pool.
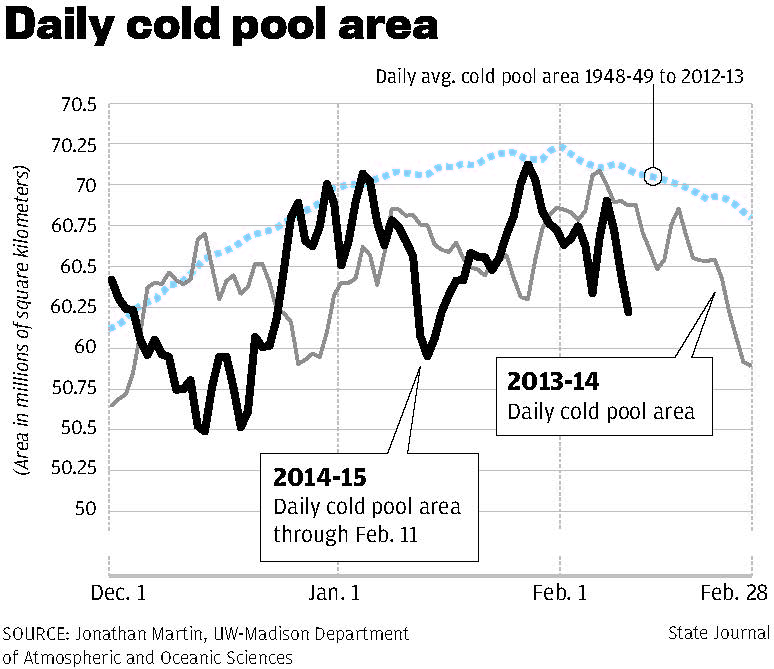 In the accompanying chart, this daily value is plotted (thick solid line) against the 66-year average (broken line) for each calendar day from Dec. 1 to Feb. 11. Also plotted is last year’s daily record (thin solid line).
Last year was the “warmest” winter, by this measure, since records began in 1948-49. Remarkably, this season appears destined to break last year’s record.
Over the last 66 winter seasons, the 90-day December-January-February average areal extent of this low-level cold air has systematically decreased. The best explanation for this long-term trend is that the Earth is warming up as a result of changes in the chemical composition of the atmosphere induced by the burning of fossil fuels.
Despite the locally cold weather we are likely to experience over the next several days, the hemisphere is getting warmer every winter.