Was 2024 an interesting weather year for Wisconsin?

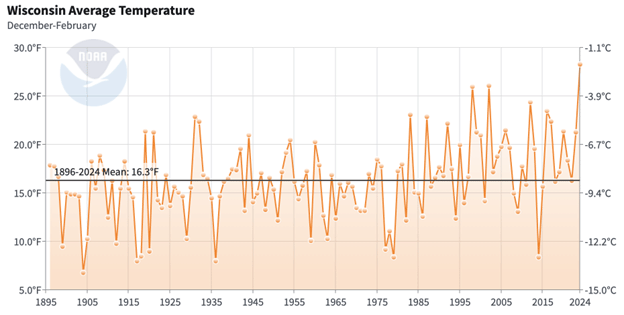
Yes, 2024 was a very interesting year. The statewide average temperature was 31.4 degrees Fahrenheit, which is 12.2 degrees warmer than the 1991-2020 normal. December 2023 to February 2024 was our warmest winter since record-keeping began in 1895. The statewide average temperature for the winter was 28.3 degrees, surpassing the previous record by 2 degrees.

Average winter temperature in Wisconsin from 1895 to 2024 with the 1895-2024 mean winter temperature overlain (Image credit: NCEI Climate at a Glance).

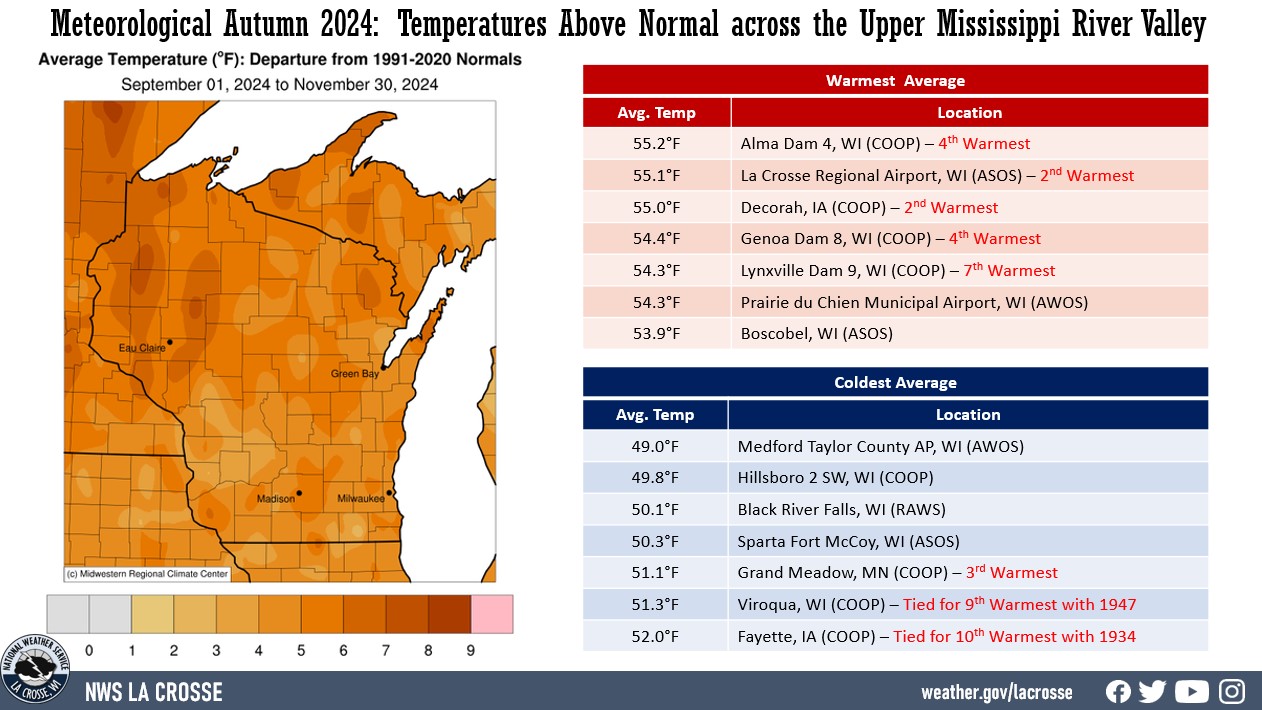
Wisconsin’s average temperature during November 2024 was 38.7 degrees, which is 7.1 degrees above the November average temperature. Seventy out of Wisconsin’s 72 counties recorded a November 2024 average temperature much above average. Overall, 2024 is on track to be Wisconsin’s warmest year on record.

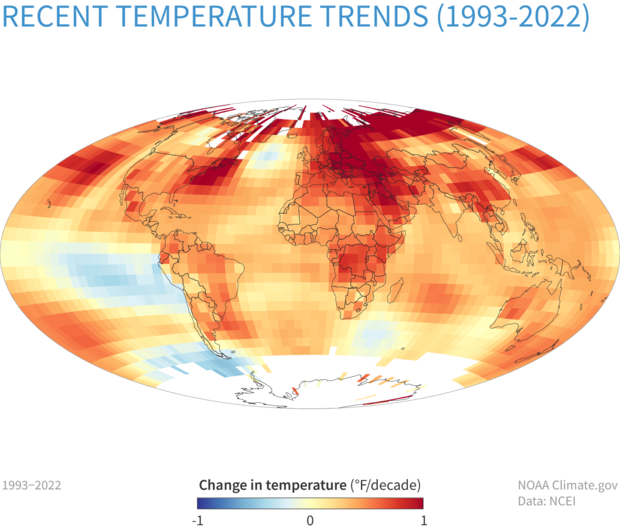
The warmth is not limited to the surface. Atmospheric scientists track the areal extent of air colder than minus 5 centigrade at about 1 mile above the surface of Earth.

This fall (September through November) we recorded the smallest average areal extent of this cold air since at least 1948. That means that 2024 had the warmest Northern Hemisphere autumn in at least the past 77 years.

This year was a tornado year. For the first time, tornadoes were observed in Wisconsin during the month of February: There were 2 of them, an EF1 and an EF2. Through November, more than 1,700 tornadoes were reported nationwide. The final count will come next year, as confirming a tornado takes time.

Three of the four wettest years on record have occurred in this century (2004, 2013 and 2024), and the state’s seasonal precipitation has increased over the long term by 1.5 inches (20% increase) since records began in 1895. May was Wisconsin’s 10th-wettest May. The statewide average precipitation during May was 5.52 inches, which exceeded the 1991-2020 normal by 1.59 inches. June 2024 ranked as Wisconsin’s sixth-wettest June on record.

Steve Ackerman and Jonathan Martin, professors in the UW-Madison department of atmospheric and oceanic sciences, are guests on WHA radio (970 AM) at noon the last Monday of each month. Send them your questions at stevea@ssec.wisc.edu or jemarti1@wisc.edu.

Category: Climate, Seasons

Comments Off on Was 2024 an interesting weather year for Wisconsin?

What is the difference between sleet and freezing rain?

Rain, snow, freezing rain, and sleet all generate hazardous traffic conditions.  Freezing rain, and the less intense freezing drizzle, can create the very treacherous road condition referred to as “black ice.” A freezing fog may similarly coat objects in ice while also reducing visibility.  Black ice is so named because the affected roadway appears dark, just like wet pavement. Black ice creates nearly zero friction conditions with vehicle tires so that correcting a skid in such conditions can be nearly impossible. 

A diagram illustrating the difference between sleet, freezing rain, and snow. (Image credit: NOAA/NWS-Northern Indiana)

Sleet consists of translucent balls of ice that are frozen raindrops. It occurs when a layer of subfreezing air at the surface is deep enough for raindrops (usually freshly melted snowflakes) to freeze as they travel through the layer. Freezing rain forms when a very shallow layer of cold air is at the surface, causing raindrops to freeze on contact with exposed objects on the ground, objects whose temperature is below freezing. Thus, both freezing rain and sleet form when there is a temperature inversion near the surface – that is, when the air temperature increases with increasing altitude. Perhaps because of this underlying similarity, the difference between sleet formation and freezing rain formation is quite small, although the two precipitation types do not look alike at all. When sleet hits the surface, it bounces and covers flat surfaces such as roads and driveways with millions of icy ball bearings as opposed to the sheet of ice left in the wake of a freezing rain event.

Steve Ackerman and Jonathan Martin, professors in the UW-Madison department of atmospheric and oceanic sciences, are guests on WHA radio (970 AM) at noon the last Monday of each month. Send them your questions at stevea@ssec.wisc.edu or jemarti1@wisc.edu.

Category: Meteorology, Seasons

Comments Off on What is the difference between sleet and freezing rain?

How does factory exhaust contribute to snowfall?

An article in the Wisconsin State Journal reported that on November 26, 2024, a factory near Menomonie, Wisconsin contributed to a narrow band of snow that extended for nearly 100 miles. This can occur only with certain atmospheric conditions.

Factory exhaust caused a narrow snow band, as seen on the preliminary, non-operational GOES-19 Advanced Baseline Imager. (Image credit: Tim Schmit, NOAA)

A cloud deck that contained supercooled water droplets was present over the area. Supercooled water droplets are liquid water that are at temperatures below freezing. This frequently occurs in cloud decks.

Relative humidity and dew point are common ways of reporting the amount of water vapor in the atmosphere. Another way is vapor pressure. Gas molecules exert a pressure when they collide with objects. The atmosphere is a mixture of gas molecules and each type contributes its part to the total atmospheric pressure. The pressure that water molecules exert is called the vapor pressure. When the relative humidity is close to 100%, the vapor pressure is close to the saturation vapor pressure.

The bonding forces of the molecules in ice are much stronger than those in water. As a result, the saturation vapor pressure over ice is much lower than that over liquid water when at the same temperature. If the air is saturated with respect to water droplets, it is supersaturated with respect to the ice crystals. Water vapor molecules will deposit onto the crystals, lowering the relative humidity of the air. In response, water molecules evaporate from the water droplets, supplying more water molecules to the air that then deposit onto the crystals. Emissions from the factory likely contained some particles that collided with the supercooled cloud droplets, and then the droplets converted to ice. This increased the ratio of ice to liquid and the ice crystals grew as the water droplets evaporated. At some point, the ice crystals were large enough to fall out of the cloud as snowfall.

Steve Ackerman and Jonathan Martin, professors in the UW-Madison department of atmospheric and oceanic sciences, are guests on WHA radio (970 AM) at noon the last Monday of each month. Send them your questions at stevea@ssec.wisc.edu or jemarti1@wisc.edu.

Category: Meteorology, Phenomena

Comments Off on How does factory exhaust contribute to snowfall?

Does the warmest autumn on record mean anything about the coming winter?

In the past several years we have occasionally mentioned our tracking of the areal extent of air colder than minus 5 degrees centigrade at about 1 mile above the surface of the Earth. This measurement has proven to be a very valuable addition to the collection of metrics of global warming. We have particularly commented on the wintertime (December, January and February) average of this extent measured over the entire Northern Hemisphere, noting that since 1948 the wintertime average extent has systematically decreased.

Wisconsin autumn temperature anomalies (Image credit: NOAA/NWS/LaCrosse)

We have also been tracking this variable throughout the autumn over all these years and can report that this fall (Sept. through Nov. 30) recorded the smallest average areal extent of this cold air since at least 1948. That means we have just experienced the warmest Northern Hemisphere autumn in at least the past 77 years.

Naturally, one wonders if this warm start will carry on throughout the coming winter. This is not a simple question as it turns out. If one were to rank the 77 autumns since 1948 in a list from warmest to coldest, one would find that the warm autumn does not necessarily lead to warm winter. In fact, only 27 of the previous 76 seasons have seen rank changes of less than 10 places between autumn and winter. So, autumn does not really provide a reasonable forecast for winter.

A fairly recent example of this disconnect comes from September 2011 to February 2012. The autumn portion of that period ranks as the sixth-warmest autumn in the time series but the following winter was the 60th-warmest winter — that is a huge change in ranking.

So, we can’t make a reliable hemispheric prediction about winter based on the recent record-setting autumn.

Steve Ackerman and Jonathan Martin, professors in the UW-Madison department of atmospheric and oceanic sciences, are guests on WHA radio (970 AM) at noon the last Monday of each month. Send them your questions at stevea@ssec.wisc.edu or jemarti1@wisc.edu.

Category: Climate, Seasons

Comments Off on Does the warmest autumn on record mean anything about the coming winter?

Is climate change uniform across the globe?

  As the map below shows, most land areas have warmed faster than most ocean areas, and the Arctic is warming faster than most other regions. Recent warming is much faster than the longer-term average, with some locations warming by 1 degree Fahrenheit or more per decade. Differences are most dramatic in the Arctic, where the loss of reflective ice and snow amplifies the rate of warming. (Image credit: NOAA Climate.gov, based on data provided by NOAA National Centers for Environmental Information)

Temperature is a fundamental indicator of a climate. Annual and seasonal temperatures patterns have a defining role in the types of animals and plants that reside in an ecosystem. Rapid changes in temperature can disrupt a wide range of natural processes. This is one reason we monitor temperature changes as a metric for global change. The National Oceanic and Atmospheric Administration’s National Centers for Environmental Information maintain a collection of climate data online at: www.ncei.noaa.gov 

Concentrations of heat-trapping greenhouse gases, such as carbon dioxide, are increasing in the Earth’s atmosphere. This increase is due to anthropogenic activity. In response, the average temperatures at the Earth’s surface are increasing and are expected to continue rising. Though global temperature changes can shift the wind patterns and ocean currents, the regional warming is not uniform.

The observed global average surface temperature has risen at an average rate of 0.17°F per decade since 1901. Since 1901, the average surface temperature across our contiguous 48 states has similarly risen at an average rate of 0.17°F per decade. The average temperatures have risen more quickly since the late 1970s: from 0.32 to 0.51°F per decade since 1979. For the contiguous United States, nine of the 10 warmest years on record have occurred since 1998.

The changes across the globe show no uniform patterns in the rate of increase. The temperatures of the Arctic are rising two to four times faster than the global average. The Antarctic Peninsula has also experienced a similarly dramatic warming. Desert areas also warmed at rates exceeding the global average warming rate.

Of course, this regional variability makes the problem of accurately predicting how the associated changes in weather patterns across the globe will change in a warmer world even more difficult to solve.  However, understanding such weather variability is absolutely critical to meeting the warmer future with in the least disruptive way.

Steve Ackerman and Jonathan Martin, professors in the UW-Madison department of atmospheric and oceanic sciences, are guests on WHA radio (970 AM) at noon the last Monday of each month. Send them your questions at stevea@ssec.wisc.edu or jemarti1@wisc.edu.

Category: Climate, History

Comments Off on Is climate change uniform across the globe?