How do radars see tornadoes?

A weather radar consists of a transmitter and a receiver. The transmitter emits pulses of radio waves outward in a circular pattern. Precipitation scatters these radio waves.

“Reflectivity” is the amount of transmitted power returned to the radar and measured by its receiver. The intensity of this received signal indicates the intensity of the precipitation.

Classic hook echo on Doppler Radar
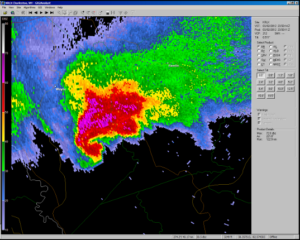
(Image credit: NWS Charleston, WV)

Measuring the time it takes for the radio wave to leave the radar and return tells us how far away the storm is. The direction the radar is pointing locates the storm.

A hook echo is a pattern in a reflectivity image. It looks like a spiral turning outward in a clockwise way, with the “thickness” of the precipitation increasing — or, a hook shape. This pattern suggests the storm is rotating and may produce a tornado. A tornado might be found at the spiral’s narrow apex.

Doppler radars measure how fast the particles in the cloud are moving toward or away from the radar. The returning radio waves have a higher frequency if the cloud particles are moving toward the radar, and a lower frequency if particles are moving away. This allows Doppler radars to identify severe weather. For example, a spinning vortex would have particles switch from moving toward and then away from the Doppler radar over a small distance.

A radio wave is an electromagnetic wave and therefore has electric and magnetic fields that are oriented perpendicular to one another. This is referred to as polarization. Dual polarized radars measure this polarization and can discern between heavy rain, hail, snow and sleet, as well as debris from a tornado.

When a tornado is on the ground, it lofts dirt, plant matter and other debris into the atmosphere. Because radar is designed to detect the presence of airborne objects, it can show meteorologists where debris is present and thus the tornado.

Steve Ackerman and Jonathan Martin, professors in the UW-Madison department of atmospheric and oceanic sciences, are guests on WHA radio (970 AM) at 11:45 a.m. the last Monday of each month. Send them your questions at stevea@ssec.wisc.edu or jemarti1@wisc.edu.

Category: Meteorology, Phenomena, Severe Weather

Comments Off on How do radars see tornadoes?

More April snow?

Weather map of a major winter storm bringing heavy snow and blizzard conditions to parts of the U.S. Northern Plains through April 12, 2022. (Image credit: NOAA)

The snow showers that visited our area on Thursday afternoon represented the fourth time snow had been in the air in Madison this month of April.

These showers were associated with the development and passage of a strong and sprawling cyclone that brought blizzard conditions to a number of locations in North Dakota and Montana from Tuesday night into Thursday. The town on Glenburn, North Dakota, received 30.5 inches of snow as of Thursday morning, with 30 to 36 inches variously reported around Minot.

These are exceptional, though not unprecedented, totals for April snows in the region. This exceptional event accounted for well over half of the entire season’s snowfall in many locations across North Dakota. In this particular instance, the severity of the late snow coupled with its duration and the accompanying wind gusts of up to 60 mph, put ranchers in the area in a difficult position as many were deep into the calving season. Ranchers prefer to keep their animals outside during the season, and newborn calves are at substantially higher risk of contracting pneumonia if they can’t stay dry after birth.

Thanks to decades of persistent advances in theory, observational technologies and computer modelling innovations, this storm was well forecasted and NWS warnings were issued well in advance of the onset of dangerous conditions. Consequently, the storm’s negative economic impact was greatly reduced.

Steve Ackerman and Jonathan Martin, professors in the UW-Madison department of atmospheric and oceanic sciences, are guests on WHA radio (970 AM) at 11:45 a.m. the last Monday of each month. Send them your questions at stevea@ssec.wisc.edu or jemarti1@wisc.edu.

Category: Meteorology, Seasons, Severe Weather

Comments Off on More April snow?

What was that stuff that fell on Wednesday and Thursday?

Graupel from Madison (Image credit: SSEC)

Last Wednesday and Thursday many locations in southern Wisconsin experienced snow squalls in which the falling precipitation was momentarily quite intense.

This event was an example of shallow convection — as opposed to the deep convection of summertime thunderstorms.

This shallow convection was spawned by a conspiracy of circumstances occurring at different levels in the atmosphere. Near the surface, the early morning sunshine led to an increase in the near-surface air temperature, while at about 3 miles above the ground the air was cooling rapidly as colder air at that level moved southward over the region.

Warming the surface and cooling the air at upper levels reduces the stability and encourages vigorous upward vertical motion and cloud production. What fell out of the sky was varied depending on your location, but many places saw snow grains, snow pellets or graupel.

These particles are frozen hydrometeors that maintain their original crystalline structure. When a preexisting piece of non-crystalline ice falls below the level at which the temperature is at or below 32 degrees, the freezing level, that particle accretes liquid water. When that particle is subsequently forced above the freezing level, that liquid coating freezes. A hailstone is produced when this process occurs several times before the particle is massive enough to fall to the ground.

Steve Ackerman and Jonathan Martin, professors in the UW-Madison department of atmospheric and oceanic sciences, are guests on WHA radio (970 AM) at 11:45 a.m. the last Monday of each month. Send them your questions at stevea@ssec.wisc.edu or jemarti1@wisc.edu.

Category: Meteorology, Seasons, Severe Weather

Comments Off on What was that stuff that fell on Wednesday and Thursday?

How common is April snow in Madison?

The recent late March and early April snow in Madison may have stirred memories of, or raised questions about, past such late winter/early spring snows.

A large snow sculpture graces State Street Mall the day after Madison saw 7.2 inches of snow on April 18, 2018, more than doubling that date’s previous record from 1912. (Credit: State Journal archives)

Perhaps unsurprisingly to Madisonians, April snow is by no means unusual here in town. Thirty Madison Aprils — out of 84 — since 1939 have had at least one 1-inch snowfall event.

The greatest April snowfall ever in Madison is the 12.9 inches that fell on April 9, 1973 – the most substantial event in a month that tallied 17.4 inches for the entire month. More recently, we have had two Aprils in which more than 10 inches of total snow fell — April 1982 (10.3 inches) and April 2018 (13.5 inches, with 7.2 inches of that coming on April 18 of that year). Coming up just short of the 10-inch monthly total was April 1994, in which 9.7 inches fell, with a remarkable 7.8 inches falling on April 30.

This winter we have struggled to accumulate much snow in Madison with a seasonal total as of Sunday of 29.9 inches, the first winter since 1980-81 to total less than 30 inches. This meager total is a result of 0.6 inches in November, 6.5 inches in December, 9.1 inches in January, 5.4 inches in February, a perfectly average 7 inches in March and 1.3 inches in April.

In 1972-73, the snowiest month of the entire cold season was April. As boring as this cold season has been with regard to snowfall, there is still an outside chance that we could become only the second winter in the past 50 years to have its snowiest month be April.

We had some measurable snow on Saturday and in the coming week we have a chance to see more. Only three Aprils in the past 40 years have had as much as 9.2 inches of snow in the month — so it is not an easy task — but if we can somehow manage to do it in Madison this April, we will join that elite list of winter seasons.

Steve Ackerman and Jonathan Martin, professors in the UW-Madison department of atmospheric and oceanic sciences, are guests on WHA radio (970 AM) at 11:45 a.m. the last Monday of each month. Send them your questions at stevea@ssec.wisc.edu or jemarti1@wisc.edu.

Category: History, Seasons

Comments Off on How common is April snow in Madison?

Where in the U.S. are the most weather warnings issued?

The 10 National Weather Service offices that issued the most weather warnings from 2012 through 2021. (Image credit: Jonathan Erdman, Weather Underground)

Certain meteorological conditions may pose threats to life and property. Under these conditions, the National Weather Service (NWS) issues advisories, weather watches and weather warnings.

A weather watch informs us that current atmospheric conditions are favorable for hazardous weather. When the hazardous weather will soon occur in an area, a warning is issued. Weather watches and warnings are issued for a wide variety of hazardous weather, including tornadoes, hurricanes, severe thunderstorms, winter storms, high wind speeds and flooding.

The NWS issues weather watches and warnings under specific weather conditions. The term “watch” implies that you should be aware that a weather hazard may develop in your area. The term “warning” means the hazard is developing in your area. You should take immediate action in the event of a warning.

Pinpointing the location of hazardous weather in advance is extremely difficult. For this reason, watches are usually issued for large geographic areas. There are 122 NWS forecast offices responsible for issuing forecasts and warnings for their area. Wisconsin has three NWS offices.

Jonathan Erdman of the Weather Channel recently compiled over 300,000 NWS warnings issued in the U.S. over the latest 10-year period from 2012 through 2021. His data show that the Norman, Oklahoma, office issued the most with 9,103 warnings. Of those, 6,926 severe thunderstorm warnings were issued and 667 were for tornados. Jackson, Mississippi, ranked second with 7,639 warnings, including 816 tornado warnings and 1,240 flash flood warnings.

In Wisconsin, the La Crosse office ranked 65th nationally, having issued 2,193 warnings during this 10-year period. Most were severe thunderstorm warnings (1,160), followed by flooding (563). There were 67 winter storm warnings and 9 blizzard warnings. The Milwaukee office ranked 79th, issuing 1,631 warnings. Of those, 904 were for severe thunderstorms and 85 for tornados. Milwaukee issued 485 flood warnings. The Green Bay office ranked 86th with 1,271 warnings.

Steve Ackerman and Jonathan Martin, professors in the UW-Madison department of atmospheric and oceanic sciences, are guests on WHA radio (970 AM) at 11:45 a.m. the last Monday of each month. Send them your questions at stevea@ssec.wisc.edu or jemarti1@wisc.edu.

Category: Meteorology, Severe Weather

Comments Off on Where in the U.S. are the most weather warnings issued?