As the spectacular fall weather continued into November last week we saw temperatures soar into the 70s on the first three days of the month before plummeting back to more normal levels with the passage of a cold front on Saturday afternoon.
The three consecutive days — Nov. 1, 2, and 3 — represented only the fourth time in Madison’s weather history that at least three consecutive days in November registered high temperatures at or above 70 degrees. All of the other instances have occurred since 2008 — Nov. 3-5, 2008; Nov. 2-4, 2015, and the all-time longest such streak, which occurred Nov. 5-9, 2020. In addition, the latest-ever 70-degree day in a Madison November occurred on Nov. 17, 2016.
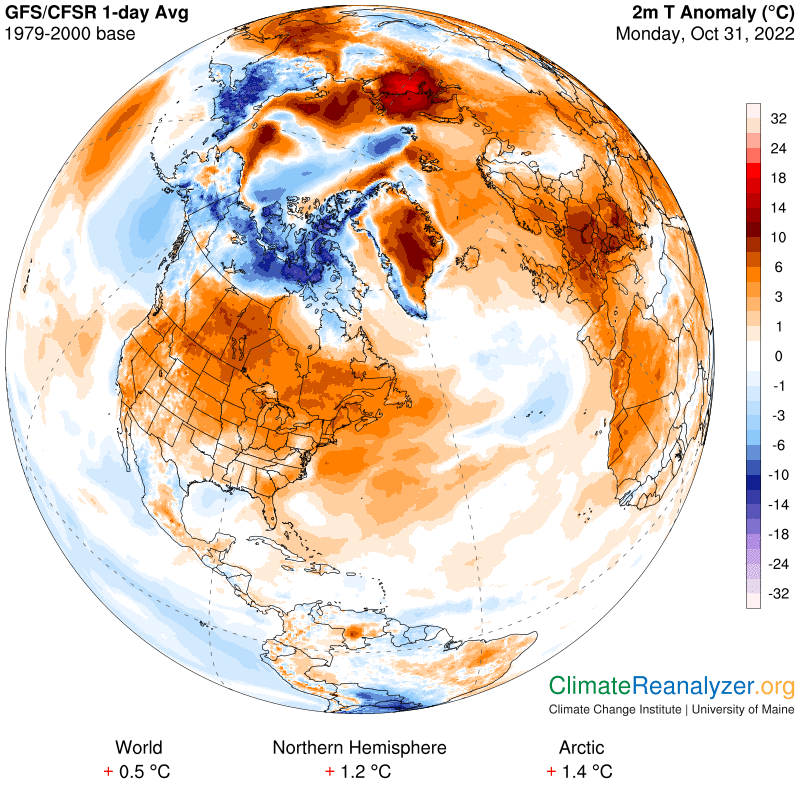
The fact that these several unusually late warm episodes have all occurred in the current century is no coincidence. Instead, it is yet another manifestation of the fact that the climate is warming.
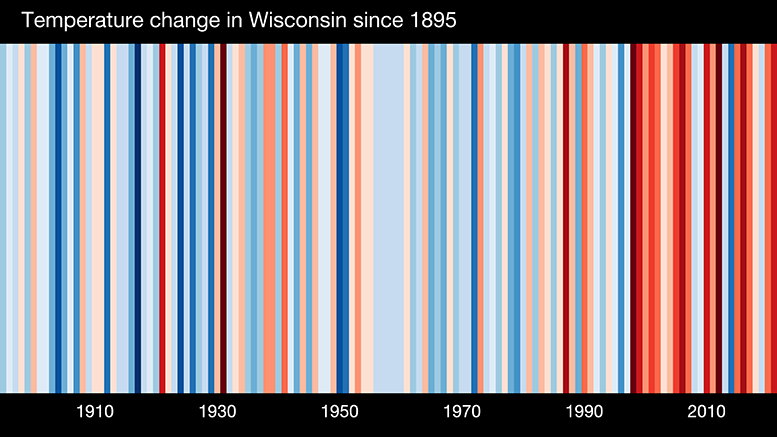
Credit: Ed Hawkins
There was a time not long ago when even the most interested citizen might struggle to find clear evidence of this warming based upon their own personal experience. This is no longer the case, as interesting episodes like this one attest. The influence of human beings in shaping this ongoing climate change is now indisputable, even as certain elected officials remain steadfastly determined to keep their eyes and ears closed about reality.
Steve Ackerman and Jonathan Martin, professors in the UW-Madison department of atmospheric and oceanic sciences, are guests on WHA radio (970 AM) at 11:45 a.m. the last Monday of each month. Send them your questions at stevea@ssec.wisc.edu or jemarti1@wisc.edu.