Is it Spring Time?

Spring marks the transition from winter to summer. In astronomical terms, the date that marks the spring in the Northern Hemisphere is the vernal equinox.

The straight line of the terminator as seen from space conveys equal day and equal night worldwide.

This year the spring equinox occurred on at 10:33 a.m. Sunday. This is the first day in 2022 that the sun is above the horizon for all locations on Earth for 12 hours. The second time will be at the fall equinox.

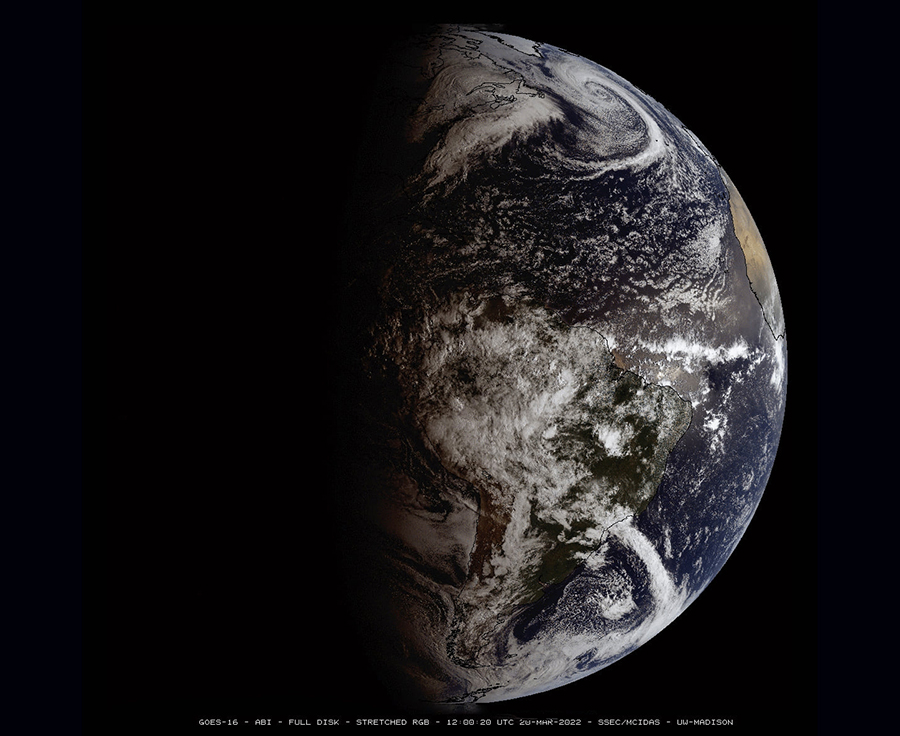
The sun rises due east and sets due west at the equinox, no matter where you live. The length of time it takes for the sun to sink below the horizon is shortest during the equinoxes. Looking at Earth from space at an equinox, you’ll see the Earth’s terminator – the dividing line between day and night – is vertical and connects the north and south poles.

The tilt of the Earth’s axis is responsible for the seasonal variation in the amount of solar energy distributed at the top of the atmosphere. The Earth’s axis is tilted at an angle of 23.5 degrees from its orbital plane. Because the Earth’s axis always points toward the North Star, the orientation of the Earth’s axis to the sun is always changing as the Earth orbits around the sun.

As this orientation changes throughout the year, so does the distribution of sunlight on the Earth’s surface at any given latitude and this is the cause of the seasons. On the equinoxes the axis is not pointed at or away from the sun, which results in all areas experiencing a little more than 12 hours of daylight.

Besides astronomy, there are other ways to mark spring. Meteorologists refer to March, April and May as the three months of spring. Phenological signs of spring can include the blooming of cherry trees or the return of specific migrating birds. Some commuters mark spring by the increase in the number of potholes.

Steve Ackerman and Jonathan Martin, professors in the UW-Madison department of atmospheric and oceanic sciences, are guests on WHA radio (970 AM) at 11:45 a.m. the last Monday of each month. Send them your questions at stevea@ssec.wisc.edu or jemarti1@wisc.edu.

Category: Climate, Meteorology, Seasons

Comments Off on Is it Spring Time?

Is mathematical pi used in meteorology?

Pi is fundamental to determining satellites’ orbit around Earth. Credit: NOAA

The ratio of a circle’s circumference to its diameter is a constant value. The size of the circle does not matter; this ratio is always the same value and is called pi.

The existence of this constant was known by the Babylonians and the Egyptians dating back to at least 2000 B.C. The numerical value is represented by the Greek letter for p, or π.

The first three digits of pi are 3.14, so today — March 14 — is often celebrated as pi day with pie. The value of π turns out to be an irrational number: Its decimal form neither ends nor becomes repetitive. The exact value is unknowable. About a decade ago, a researcher calculated the value to 2.7 trillion digits.

You might have first encountered pi in early classes on geometry or trigonometry. You learned that pi, along with the radius, is used to calculate the circumference of a circle, the area of a circle or the volume of a sphere. Since cloud droplets are near spherical, pi is used to calculation how much water is in a cloud knowing the number and size of the drops.

Because of pi’s relationship to the circle and to spherical coordinate systems, it appears in many formulas in many areas of mathematics and physics. Meteorology is a physical science, steeped in math, so we inevitably encounter pi.

Pi appears in the field of electromagnetics, which is used to describe how light travels through the atmosphere. It is used in equations that describe why the sky is blue.

Pi appears in equations describing processes that are periodic, and therefore is intimately associated with waves. Atmospheric patterns and the movement of the winds can be described as waves. So, pi appears in mathematical equations that describe the movement of weather systems. The waviness pattern of the jet stream can be described by its “meandering ratio,” which includes the value of pi.

A world without pi, and pie, would be very different.

Steve Ackerman and Jonathan Martin, professors in the UW-Madison department of atmospheric and oceanic sciences, are guests on WHA radio (970 AM) at 11:45 a.m. the last Monday of each month. Send them your questions at stevea@ssec.wisc.edu or jemarti1@wisc.edu.

Category: History, Meteorology

Comments Off on Is mathematical pi used in meteorology?

Is Wisconsin getting windier?

Before we delve into the question of whether Wisconsin is getting windier, let’s review some basics regarding wind.

Wind is moving air. Weather reports include observations of wind speed and direction measured at the height of 10 meters (33 feet) above the surface. If the wind speed is strong — greater than 17 mph — and highly variable, the weather report will include the wind gust, which is the maximum observed wind speed.

Wind direction is the direction from which the wind is blowing. A north wind blows from the north toward the south.

Madison’s average wind speeds for past 70 years (Image credit: Lee Enterprises)

One way to answer the windier question is to average the wind speed measured over a city over a year, and so determine the annual wind speed. The change in the annual wind speed over a long period of time indicates the long-term trend in wind speed.

Madison has a record of wind speed observations dating back to 1948. The accompanying graph shows the annual average wind speed for Madison for a given year. The trend is decreasing wind speed over this time period. So, Madison is getting less windy with time.

Observations at Milwaukee also go back to 1948 and show a decreasing trend as well. The wind speed at Eau Claire also has trended slower since 1960s. There is no clear trend for the city of La Crosse.

If we calculate an average wind speed over each month for the entire time period of 1948-2022, we find that the month of April is the windiest with an average wind speed of 11.4 mph. The March average wind speed is 11.3 mph, greater than the February mean of 10.4 mph.

So, with respect to the monthly mean wind speed, March is windier than February and April is windier than March in Madison. After April, the monthly mean wind speed declines. The lowest monthly mean occurs in August, with 7.0 mph.

Steve Ackerman and Jonathan Martin, professors in the UW-Madison department of atmospheric and oceanic sciences, are guests on WHA radio (970 AM) at 11:45 a.m. the last Monday of each month. Send them your questions at stevea@ssec.wisc.edu or jemarti1@wisc.edu.

Category: Climate, Meteorology

Comments Off on Is Wisconsin getting windier?

How are we doing for snowfall this season?

Precipitation forecast for March 2022 (Image credit: Climate Prediction Center, NOAA/NCEP)

Despite the persistence of snow and ice on the ground this winter, since our first real covering appeared just after Christmas Day, it has been a remarkably snowless winter thus far.

After Thursday night’s 2.7-inch snowfall, the season total for Madison rose to a paltry 21.4 inches, which places us well behind the average for the season to this point, which is 41.3 inches.

Just how unusual is this amount?

It turns out that about 25% of the time a winter season accumulates less than 30 inches of snow in Madison. In 138 seasons, dating back to 1884-85, Madison has had only 33 winters in which the total snowfall remained below that threshold — the last one of those was 2002-03, when only 28.8 inches accumulated.

Thirteen seasons have received less than 25 inches of snow, the last one being 1967-68, when only 12.7 inches fell. That season was the most recent of only five seasons in which less than 20 inches of snow fell in a season — the other four were 1933-34, 1913-14, 1901-02 and 1894-95. Of those five, the all-time least snowy winter was 1901-02 when, unbelievably, only 4 inches accumulated for the season.

Since 7 inches of snow falls in Madison in an average March, we will have to have a snowier than normal March to move past 30 inches of snow for this season.

Though it is subject to substantial revision, the forecast for the coming first two weeks of March does suggest the possibility of a couple of sizable snowfalls that just might rescue us from landing on this list of exceptionally boring winters.

Steve Ackerman and Jonathan Martin, professors in the UW-Madison department of atmospheric and oceanic sciences, are guests on WHA radio (970 AM) at 11:45 a.m. the last Monday of each month. Send them your questions at stevea@ssec.wisc.edu or jemarti1@wisc.edu.

Category: Climate, Meteorology, Seasons

Comments Off on How are we doing for snowfall this season?

How did the Tonga eruption affect the atmosphere?

Hunga Tonga erupted on Jan. 15 and lasted 11 hours.

JMA Himawari-8 True Color RGB image showed the rapid expansion of a volcanic cloud following an explosive eruption of Hunga Tonga on 15 January 2022. An abrupt shock wave was also evident, which propagated radially outward in all directions. (Photo credit: CIMSS Satellite Blog)

It devastated the region, covering the land in a layer of ash. The eruption blasted a plume of ash and water vapor 34 miles into the atmosphere — into the mesosphere.

The Hunga Tonga plume contained only a very small amount of sulfur dioxide (SO2). Sulfur dioxide from volcanic mega-eruptions that reach high in the atmosphere can have an impact on global temperature. The mega-eruption of Pinatubo in 1991 released enough sulfur dioxide to cool the Earth’s surface for three years. The Tonga eruption will not have that kind of impact.

Lightning is common with volcanic eruptions. The turbulence in the eruption plume makes particles of ash and water collide to rub together, generating electrical charges that lead to lightning. Hunga Tonga was no exception, producing nearly 400,000 lightning strikes.

The shockwave from the eruption caused an atmospheric pressure wave that traveled around the globe. It was measured at weather stations around the world. The pressure wave circumnavigated the globe at nearly 700 mph. Associated with the pressure wave were short-lived upward motions that generated thin clouds observed at Hawaii. Satellite observations measured temperature fluctuations in the upper troposphere and lower stratosphere that accompanied the pressure wave.

The atmospheric pressure wave also pushed water all the way to Puerto Rico. This resulting wave, measuring about 4 inches in height, resulted from the atmospheric pressure wave and is referred to as a meteotsunami. Tsunamis are triggered by seismic activity; water waves driven by air pressure disturbances are called meteotsunamis.

Steve Ackerman and Jonathan Martin, professors in the UW-Madison department of atmospheric and oceanic sciences, are guests on WHA radio (970 AM) at 11:45 a.m. the last Monday of each month. Send them your questions at stevea@ssec.wisc.edu or jemarti1@wisc.edu.

Category: Climate, Phenomena

Comments Off on How did the Tonga eruption affect the atmosphere?