The National Oceanic and Atmospheric Administration (NOAA) operates weather satellites with instruments capable of locating fires and determining fire characteristics such as size and intensity. These satellites also are critical to observing and monitoring smoke from those fires.
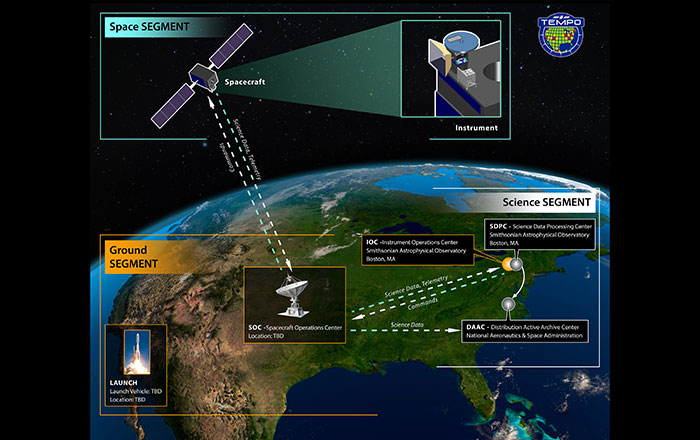
NASA recently launched a new satellite instrument to monitor air pollution. The Tropospheric Emissions: Monitoring of Pollution, or TEMPO, was launched into geostationary orbit on April 6, 2023. TEMPO measurements join an international satellite constellation of observations that will track pollution around the globe. The instrument measures sunlight reflected off Earth’s surface and solar energy scattered by clouds and the atmosphere. Gases in the atmosphere absorb sunlight at particular wavelengths, and the measured color spectra is used to determine the concentrations of several gases in the air, including nitrogen dioxide.
TEMPO is the first space-based instrument to monitor major air pollutants hourly and at high spatial resolution of 4 square miles. Observations of nitrogen dioxide concentration at this temporal and spatial detail will enable scientists to study rush hour pollution and the movement of pollution from forest fires. It can also help measure nitrogen dioxide released when the application of fertilizer on farms is followed by rainfall.
TEMPO data will help scientists evaluate the health impacts of pollutants and aid in the creation of air pollution maps at the neighborhood scale, improving understanding of disparities in air quality within a community. NASA will share the data with other agencies that monitor and forecast air quality, such as the Environmental Protection Agency (EPA) and the National Oceanic and Atmospheric Administration (NOAA).
Scientists at the University of Wisconsin’s Space Science and Engineering Center are members of NASA’s TEMPO science team and will monitor the presence of air pollutants over North America to help improve air quality forecasts.
Steve Ackerman and Jonathan Martin, professors in the UW-Madison department of atmospheric and oceanic sciences, are guests on WHA radio (970 AM) at 11:45 a.m. the last Monday of each month. Send them your questions at stevea@ssec.wisc.edu or jemarti1@wisc.edu.