The stratosphere, which begins approximately 6 miles above the cold poles and 10 miles above the tropics, is where the temperature increases with altitude. Temperatures increase because ozone molecules in the stratospheric ozone layer absorb solar ultraviolet energy within the stratosphere. Air flow in the stratosphere is much less turbulent than in the troposphere. For this reason, jet aircraft pilots like to cruise at stratospheric altitudes so the flight is less bumpy. In polar regions, the top of the stratosphere extends upward to around 30 miles.
The polar vortex is a band of strong winds high in the atmosphere that spins counterclockwise around the North Pole. At the southern edge of the vortex is the polar jet stream, which separates warm air to its south from increasingly colder air to its north.
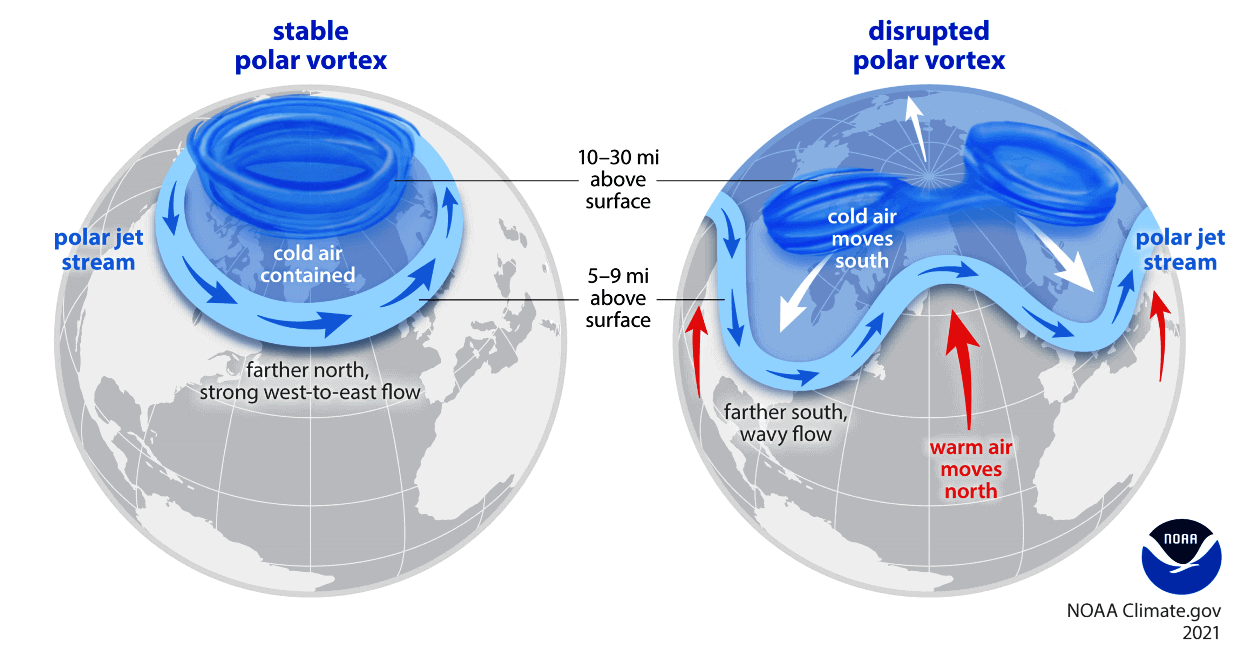
A sudden stratospheric warming, or SSW, occurs in the winter, when the polar stratosphere warms and the winds that normally flow from west to east around the pole weaken dramatically and even reverse direction. This phenomenon occurs about six times per decade and leads to a breakdown of the polar vortex. SSWs can cause the polar night jet to weaken, which allows cold air near the polar cap to expand into the middle latitudes.
This year has seen an interesting arctic stratospheric pattern — a major SSW happened twice this year, once in mid-January and again at the end of February. These SSWs warm the arctic stratosphere and decelerate the polar vortex. This is really good news for arctic total ozone levels, since SSWs increase arctic ozone by large amounts and these high amounts persist into spring and summer, decreasing the amount of ultraviolet energy that can reach the surface.
Steve Ackerman and Jonathan Martin, professors in the UW-Madison department of atmospheric and oceanic sciences, are guests on WHA radio (970 AM) at 11:45 a.m. the last Monday of each month. Send them your questions at stevea@ssec.wisc.edu or jemarti1@wisc.edu.