Are the number of thunderstorms in Wisconsin decreasing?

This question comes from one of our readers, based on casual observation. It is always good to get data and analyze such a generalization to find the best answer. So, we turned to the Wisconsin State Climatology Office.

The National Weather Service records the number of thunderstorm days at several sites across the U.S. A thunderstorm day is when thunder or lightning is detected at least once during the day. Since the mid-1990s, the nation’s primary surface weather observation network is the Automated Surface Observing Systems, or ASOS program, which has essentially replaced human observers.

NWS thunderstorm categories.

ASOS is a joint effort of the National Weather Service, the Federal Aviation Administration and the Department of Defense. These automated weather stations routinely measure temperature, humidity, winds, visibility and precipitation. Some ASOS sites also have a single-site lightning sensor. We can detect lightning by observing an optical flash or an electrical field change. If lightning is detected, a thunderstorm is in the area.

Additionally, two different networks in the United States — the National Lightning Detection Network and the Earth Networks Total Lightning Network — also detect lightning flashes. These two systems work by detecting radio waves generated by lightning strokes. Since 2016, a Geostationary Lightning Mapper instrument has flown on two weather satellites that map total lightning activity.

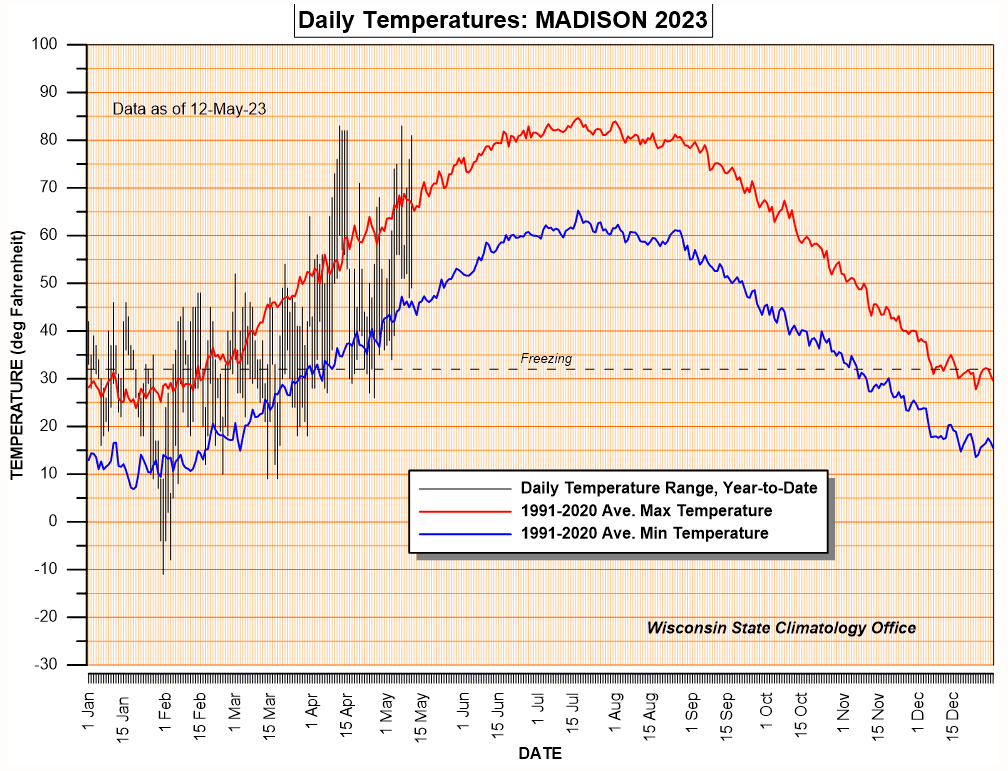
An analysis of the annual number of thunderstorm days at the Dane County Regional Airport in Madison shows no obvious trend, although the average number of thunderstorm days between 1990 and 2020 is a bit smaller than during the 30-year period of 1950-1980. An analysis of the number of thunderstorms in Green Bay and La Crosse does show a gradual decline in thunderstorm days. There are no upward trends in the number of thunderstorm days at these sites.

Steve Ackerman and Jonathan Martin, professors in the UW-Madison department of atmospheric and oceanic sciences, are guests on WHA radio (970 AM) at 11:45 a.m. the last Monday of each month. Send them your questions at stevea@ssec.wisc.edu or jemarti1@wisc.edu.

Category: Climate, Meteorology, Severe Weather

Comments Off on Are the number of thunderstorms in Wisconsin decreasing?

Why was the sun so red this past week?

Light is a form of electromagnetic energy that does not need matter to propagate. We can characterize this energy by its wavelength, which is the distance along a wave from one crest to another. Our eyes are sensitive to light with wavelengths between approximately 0.4 to 0.7 microns. Blue colors have shorter wavelengths, while red colors have longer ones.

When light interacts with particles suspended in air, it can be scattered or absorbed. Energy that is scattered causes a change in direction of the light path. The amount of light that is being scattered is a function of the size of the particle relative to the wavelength of the light falling on the particle. While all colors are scattered by air molecules, violet and blue are scattered most. The sky looks blue, not violet, because our eyes are more sensitive to blue light.

Wisconsin sunrise on May 22nd. Credit: Amy Larson

This past week, upper-level winds carried smoke from fires in western Canada over the Midwest. Smoke can cause the sky to appear hazy, even if the smoke is high above the ground. When smoke is thick, it can cause brilliant red sunsets and sunrises. Small smoke particles scatter blue light. So, as the sun sets or rises and its rays pass through the smoke plume, all the blue lights are scattered out of the path between the setting sun and your eyes, leaving only the red and orange colors. This results in the sun having a bright red color.

If the winds are right, the smoke can be transported down to the ground. This can cause a reduction in air quality. The small particles that make up the smoke can cause respiratory problems, particularly for children, the elderly, and people with asthma.

Steve Ackerman and Jonathan Martin, professors in the UW-Madison department of atmospheric and oceanic sciences, are guests on WHA radio (970 AM) at 11:45 a.m. the last Monday of each month. Send them your questions at stevea@ssec.wisc.edu or jemarti1@wisc.edu.

 
Category: Meteorology, Phenomena, Weather Dangers

Comments Off on Why was the sun so red this past week?

Can record high and low temperatures help define regional definitions of seasons?

Though it now seems to be fully in swing, the spring has sure seemed delayed in coming this year in southern Wisconsin. This made us wonder if there might be a more refined, and local, way to think about the calendar-day boundaries of the seasons.

In research undertaken to write a recent column, we catalogued Madison’s record high and low temperature data for each calendar day employing data that went back to 1939. An interesting partition of the full year resulted from this simple analysis.

It turns out that not once over these past 83 years has a daily record low temperature been 32 degrees or lower between June 11 and Sept. 11. Might this be a valid reason to suggest summer in Madison extends from June 11 through Sept. 11?

On the other extreme, at least once over these last 83 years, a record low has been zero or below on every day from Nov. 23 to March 15. Might this be a valid reason to suggest that winter in Madison extends from Nov. 23 to March 15?

Once these notions are entertained, they really start to make intuitive sense. Of course, then “spring” in Madison would extend from March 16 to June 10 (again, roughly consistent with a native’s impression), and “autumn” would extend from Sept. 12 to Nov. 22.

2023 Daily Temperatures for Madison bounded by historical averages.
Credit: Wisconsin State Climatology Office

There may be more sophisticated ways to characterize the seasons locally, but using just two seemingly arbitrary temperature thresholds as we’ve done here returns a fairly satisfactory result.

Steve Ackerman and Jonathan Martin, professors in the UW-Madison department of atmospheric and oceanic sciences, are guests on WHA radio (970 AM) at 11:45 a.m. the last Monday of each month. Send them your questions at stevea@ssec.wisc.edu or jemarti1@wisc.edu.

Category: Climate, Meteorology, Seasons

Comments Off on Can record high and low temperatures help define regional definitions of seasons?

What are gravity waves?

In a gravity wave, the upward moving region is the most favorable region for cloud development and the sinking region favorable for clear skies. That is why you may see rows of clouds and clear areas between the rows of clouds. A gravity wave is nothing more than a wave moving through a stable layer of the atmosphere.  (Image credit: NOAA)

Picture a rock thrown into a lake on a calm day. That is an excellent example of what a gravity wave looks like.

Ripples migrate from where the rock hits the water, causing an up and down motion along the water’s surface. As we get farther away from the point where the rock hit the water, the waves dampen, becoming less defined.

These ripples, or waves, travel along a stable boundary between the water surface and the air above. Gravity waves also occur along stable layers but in the atmosphere.

To understand how gravity waves form, imagine a small volume of air, large enough to contain a very great number of molecules, but small enough so that the properties assigned to it are approximately uniform. In a stable atmosphere, if an air parcel is forced to rise or sink, the parcel will tend to return to its original position. If the air parcel ins in an unstable atmosphere, it will accelerate away from its initial position after being pushed. Atmospheric gravity waves form in stable air when parcels are forced upward and gravity pulls it back down.

As with the stone thrown in a pond, to start a gravity wave in the atmosphere, we need a perturbation to displace an air parcel in the vertical. Flow over mountains and thunderstorm updrafts are good examples of trigger mechanisms. An upward moving parcel expands and cools, making favorable condition for cloud development. A downward moving parcel is compressed and warms, lowering the humidity.

Gravity waves in the atmosphere sometimes appear as rows of clouds between rows of clear area. The upward moving region is the most favorable region for cloud development and the sinking region favorable for clear skies.

Steve Ackerman and Jonathan Martin, professors in the UW-Madison department of atmospheric and oceanic sciences, are guests on WHA radio (970 AM) at 11:45 a.m. the last Monday of each month. Send them your questions at stevea@ssec.wisc.edu or jemarti1@wisc.edu.

Category: Meteorology, Phenomena

Comments Off on What are gravity waves?

What is happening with ocean temperatures?

This world map shows sea surface temperature anomalies during one of the strongest El Nino events on record in 2016. The red areas indicate warmer-than-average ocean temperatures, while blue areas represent cooler-than-average temperatures. (Image credit: NOAA)

Scientists record global ocean temperatures using satellite observations. Since mid-March, the global average sea surface temperature has been more than 70 degrees, a record high temperature. This indicates rapid warming, which is associated with global warming and ocean circulations.

El Niño and La Niña are climate patterns in the Pacific Ocean. Normally, the trade winds blow west along the equator, moving warm water from South America toward Asia. To replace that warm water, cold water rises from the ocean depths — a process called upwelling. That means cold water rises to the surface near South America.

During La Niña events, trade winds are stronger than usual, pushing more warm water toward Asia and stronger upwelling. La Niña causes water in the eastern Pacific to be colder than usual. During El Niño, trade winds weaken, and warm water is pushed back toward the west coast of the Americas. El Niño causes the ocean surface water to be warmer than average.

A La Niña pattern has been in place for the last three years. Observations indicate the Pacific Ocean is switching to an El Niño pattern, which is contributing to the warming ocean surface temperatures.

We associate El Niño conditions with certain weather patterns across the globe. Over North America, the jet stream is weaker and farther north during the summer months, minimizing the effects of El Niño on weather in the United States.

The impacts of El Niño in temperate latitudes are most evident during winter. A weak polar jet stream forms over eastern Canada, and as a result, a large part of North America is warmer than normal. Changes in precipitation and temperature patterns caused by El Niño affect snowfall in the United States, reducing total winter snowfall in the Midwest and New England regions.

Steve Ackerman and Jonathan Martin, professors in the UW-Madison department of atmospheric and oceanic sciences, are guests on WHA radio (970 AM) at 11:45 a.m. the last Monday of each month. Send them your questions at stevea@ssec.wisc.edu or jemarti1@wisc.edu.

Category: Climate, Phenomena, Tropical

Comments Off on What is happening with ocean temperatures?