What are gravity waves?

In a gravity wave, the upward moving region is the most favorable region for cloud development and the sinking region favorable for clear skies. That is why you may see rows of clouds and clear areas between the rows of clouds. A gravity wave is nothing more than a wave moving through a stable layer of the atmosphere.  (Image credit: NOAA)

Picture a rock thrown into a lake on a calm day. That is an excellent example of what a gravity wave looks like.

Ripples migrate from where the rock hits the water, causing an up and down motion along the water’s surface. As we get farther away from the point where the rock hit the water, the waves dampen, becoming less defined.

These ripples, or waves, travel along a stable boundary between the water surface and the air above. Gravity waves also occur along stable layers but in the atmosphere.

To understand how gravity waves form, imagine a small volume of air, large enough to contain a very great number of molecules, but small enough so that the properties assigned to it are approximately uniform. In a stable atmosphere, if an air parcel is forced to rise or sink, the parcel will tend to return to its original position. If the air parcel ins in an unstable atmosphere, it will accelerate away from its initial position after being pushed. Atmospheric gravity waves form in stable air when parcels are forced upward and gravity pulls it back down.

As with the stone thrown in a pond, to start a gravity wave in the atmosphere, we need a perturbation to displace an air parcel in the vertical. Flow over mountains and thunderstorm updrafts are good examples of trigger mechanisms. An upward moving parcel expands and cools, making favorable condition for cloud development. A downward moving parcel is compressed and warms, lowering the humidity.

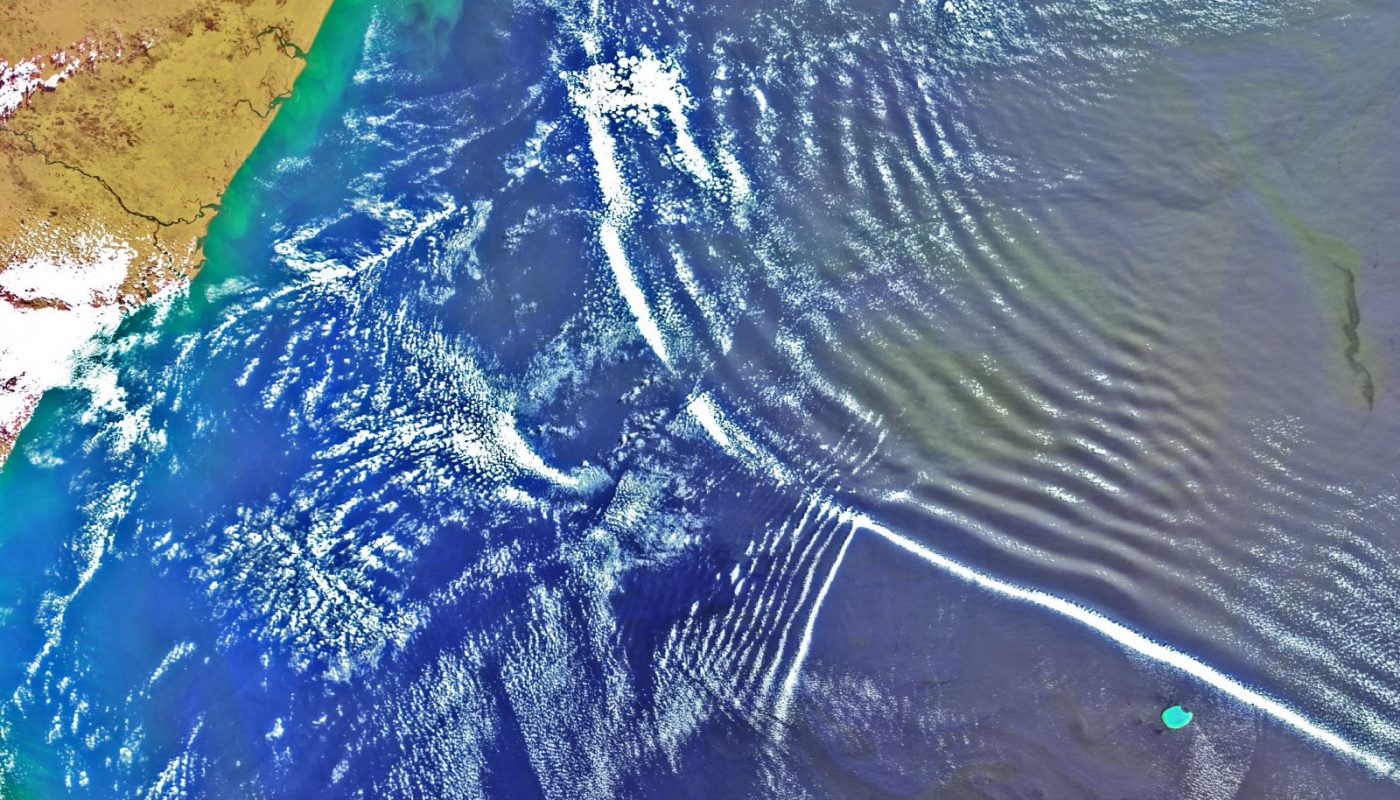
Gravity waves in the atmosphere sometimes appear as rows of clouds between rows of clear area. The upward moving region is the most favorable region for cloud development and the sinking region favorable for clear skies.

Steve Ackerman and Jonathan Martin, professors in the UW-Madison department of atmospheric and oceanic sciences, are guests on WHA radio (970 AM) at 11:45 a.m. the last Monday of each month. Send them your questions at stevea@ssec.wisc.edu or jemarti1@wisc.edu.

Category: Meteorology, Phenomena

Comments Off on What are gravity waves?

What is happening with ocean temperatures?

This world map shows sea surface temperature anomalies during one of the strongest El Nino events on record in 2016. The red areas indicate warmer-than-average ocean temperatures, while blue areas represent cooler-than-average temperatures. (Image credit: NOAA)

Scientists record global ocean temperatures using satellite observations. Since mid-March, the global average sea surface temperature has been more than 70 degrees, a record high temperature. This indicates rapid warming, which is associated with global warming and ocean circulations.

El Niño and La Niña are climate patterns in the Pacific Ocean. Normally, the trade winds blow west along the equator, moving warm water from South America toward Asia. To replace that warm water, cold water rises from the ocean depths — a process called upwelling. That means cold water rises to the surface near South America.

During La Niña events, trade winds are stronger than usual, pushing more warm water toward Asia and stronger upwelling. La Niña causes water in the eastern Pacific to be colder than usual. During El Niño, trade winds weaken, and warm water is pushed back toward the west coast of the Americas. El Niño causes the ocean surface water to be warmer than average.

A La Niña pattern has been in place for the last three years. Observations indicate the Pacific Ocean is switching to an El Niño pattern, which is contributing to the warming ocean surface temperatures.

We associate El Niño conditions with certain weather patterns across the globe. Over North America, the jet stream is weaker and farther north during the summer months, minimizing the effects of El Niño on weather in the United States.

The impacts of El Niño in temperate latitudes are most evident during winter. A weak polar jet stream forms over eastern Canada, and as a result, a large part of North America is warmer than normal. Changes in precipitation and temperature patterns caused by El Niño affect snowfall in the United States, reducing total winter snowfall in the Midwest and New England regions.

Steve Ackerman and Jonathan Martin, professors in the UW-Madison department of atmospheric and oceanic sciences, are guests on WHA radio (970 AM) at 11:45 a.m. the last Monday of each month. Send them your questions at stevea@ssec.wisc.edu or jemarti1@wisc.edu.

Category: Climate, Phenomena, Tropical

Comments Off on What is happening with ocean temperatures?

What causes April showers?

The vertical distribution of temperature will often determine the type of precipitation (rain vs. snow vs. sleet vs. freezing rain) that occurs at the surface during the development of “wintry mix.” More often than not, the temperature does not decrease with height but increases, many times by several degrees, before decreasing. This increase, then decrease is called an inversion. During wintry mix precipitation, an inversion can be critical in determining the type or types of weather. (Image credit: weather.gov)

The weather this past week in Madison has been very interesting.

On at least three occasions we experienced a mix of precipitation types — with snow, hail, graupel and rain in various combinations.

Early in the week the precipitation was delivered by the passage of a mid-latitude cyclone. These disturbances are organized on very large scales and have a characteristic distribution of clouds and precipitation associated with them. The early week precipitation was most closely tied to the passage of the cold frontal portion of the larger cyclone.

By the nature of their large-scale structure, such storms usually have a region of quite cold air at about 3 miles above the surface trailing to their west and northwest. When this air moves over a given location, the temperature difference between the surface and 3 miles above the surface naturally increases. This increased temperature difference reduces the resistance air parcels have to move in the vertical direction. Since this usually substantial resistance is lessened in such cases, upward vertical motions (which produce cloud and precipitation) are more easily generated.

The widespread, but intermittent, snow and graupel over southern Wisconsin on Saturday was largely a consequence of this set of physical circumstances. The fact that the showers abruptly ceased after sunset is another characteristic of this kind of precipitation generation mechanism in action.

Since April, as we all know, is still capable of delivering pretty cold temperatures, it turns out that a large fraction of this month’s fabled April showers are produced in exactly this manner.

Steve Ackerman and Jonathan Martin, professors in the UW-Madison department of atmospheric and oceanic sciences, are guests on WHA radio (970 AM) at 11:45 a.m. the last Monday of each month. Send them your questions at stevea@ssec.wisc.edu or jemarti1@wisc.edu.

Category: Meteorology, Seasons

Comments Off on What causes April showers?

How could we be in a fire danger this early in spring after all the winter snow?

A Red Flag Warning was issued by the National Weather Service in conjunction with the Wisconsin Department of Natural Resources on Friday, April 14, 2023. A Red Flag Warning is issued when a variety of weather factors come together to create especially dangerous wildland fire conditions.

This 2022-23 winter — December through February — was exceptional in that it was Wisconsin’s wettest meteorological winter on record, and those records go back to 1895.

The state also experienced significant snowfall in March. When the snow slowly melts into the soil, it provides needed water for plant growth.

Fires require fuel to burn, air to supply oxygen, and a heat source to get the fuel to its ignition temperature. Regardless of how much snow fell during winter, if we have a few days of hot, dry and windy weather in early spring, vegetation will dry out, providing fuel to burn if ignited.

A wet winter also can become a wildfire problem later in the summer. The snowfall provides moisture for plant production. A summer drought can kill plants, leaving behind a fuel source for a fire.

This past week, Wisconsin and other northern states were under a red flag warning. The National Weather Service issues a red flag warning when warm temperatures, very low humidity and strong winds are expected. These weather conditions combine to produce an increased risk of a fire and the warning alerts fire officials and firefighters of potentially dangerous conditions within the next 12 to 24 hours. High winds also help spread the fires. Red flag conditions also alert the public to be cautious and not ignite a fire.

NWS issuance of a red flag warning is based on wind speed, humidity and how dry the ground is, but exact thresholds vary by region. In Wisconsin, these conditions generally occur in the springtime before plants green up and in the fall before there is snow on the ground.

Steve Ackerman and Jonathan Martin, professors in the UW-Madison department of atmospheric and oceanic sciences, are guests on WHA radio (970 AM) at 11:45 a.m. the last Monday of each month. Send them your questions at stevea@ssec.wisc.edu or jemarti1@wisc.edu.

Category: Climate, Seasons, Weather Dangers

Comments Off on How could we be in a fire danger this early in spring after all the winter snow?

How is air pollution measured?

There are different sources of air pollution, including human-generated emissions from the burning of fossil fuel, as well as natural sources such as wildfires, volcanic eruptions and dust storms.

Particle pollution is referred to particulate matter (PM) and is made up of small, suspended solid or liquid particles. The amount and density of pollutants in the air are converted into an Air Quality Index (AQI). An AQI of less than 50 is considered safe, while unhealthy conditions have an AQI above 100. The chemical composition of the pollutant can also be a health concern.

Some air quality monitors use lasers to determine the density of particulate matter. Other methods include passing air through filters and then measuring the material collected on the filter.

The Environment Protection Agency has a nationwide network of monitoring sites to measure conditions of particulate matter. PM2.5 describes fine inhalable particles, with diameters that are generally 2.5 micrometers and smaller. Analysis of observations demonstrate that the average PM2.5 concentration has been decreasing nationally, an indication that air quality is improving.

Last week NASA launched a new satellite instrument to monitor air pollution. The Tropospheric Emissions: Monitoring of Pollution, or TEMPO, was launched into geostationary orbit on Thursday. TEMPO is the first space-based instrument to monitor major air pollutants hourly and at high spatial resolution of 4 square miles.

Observations of such temporal and spatial detail enable research studies of rush hour pollution, the movement of pollution from forest fires, and even the impact of fertilizer application. The TEMPO measurements will join a global satellite constellation of observations that will track pollution around the globe.

This animation demonstrates the east to west scanning strategy of TEMPO’s hourly profile of air pollutants over North America using proxy NO2 data. (Credit: Robert Carp, SSEC)

Scientists at UW-Madison’s Space Science and Engineering Center are members of NASA’s TEMPO science team and will monitor the presence of air pollutants over North America and help improve air quality forecasts.

Steve Ackerman and Jonathan Martin, professors in the UW-Madison department of atmospheric and oceanic sciences, are guests on WHA radio (970 AM) at 11:45 a.m. the last Monday of each month. Send them your questions at stevea@ssec.wisc.edu or jemarti1@wisc.edu.

Category: Meteorology, Weather Dangers

Comments Off on How is air pollution measured?