Weather satellites fly around Earth in two basic orbits: a geostationary Earth orbit (abbreviated as GEO) and a low Earth orbit (abbreviated as LEO). LEO satellites’ orbits often travel over the Earth’s polar regions, flying at an altitude of 530 miles. Geostationary satellites orbit Earth as fast as Earth spins and so hover over a single point above Earth at an altitude of about 22,300 miles. To maintain its position, a GEO satellite must be located over the equator. In contrast, polar satellites go around from pole to pole as the Earth rotates beneath the satellite; each orbit is slightly to the west of the previous one.
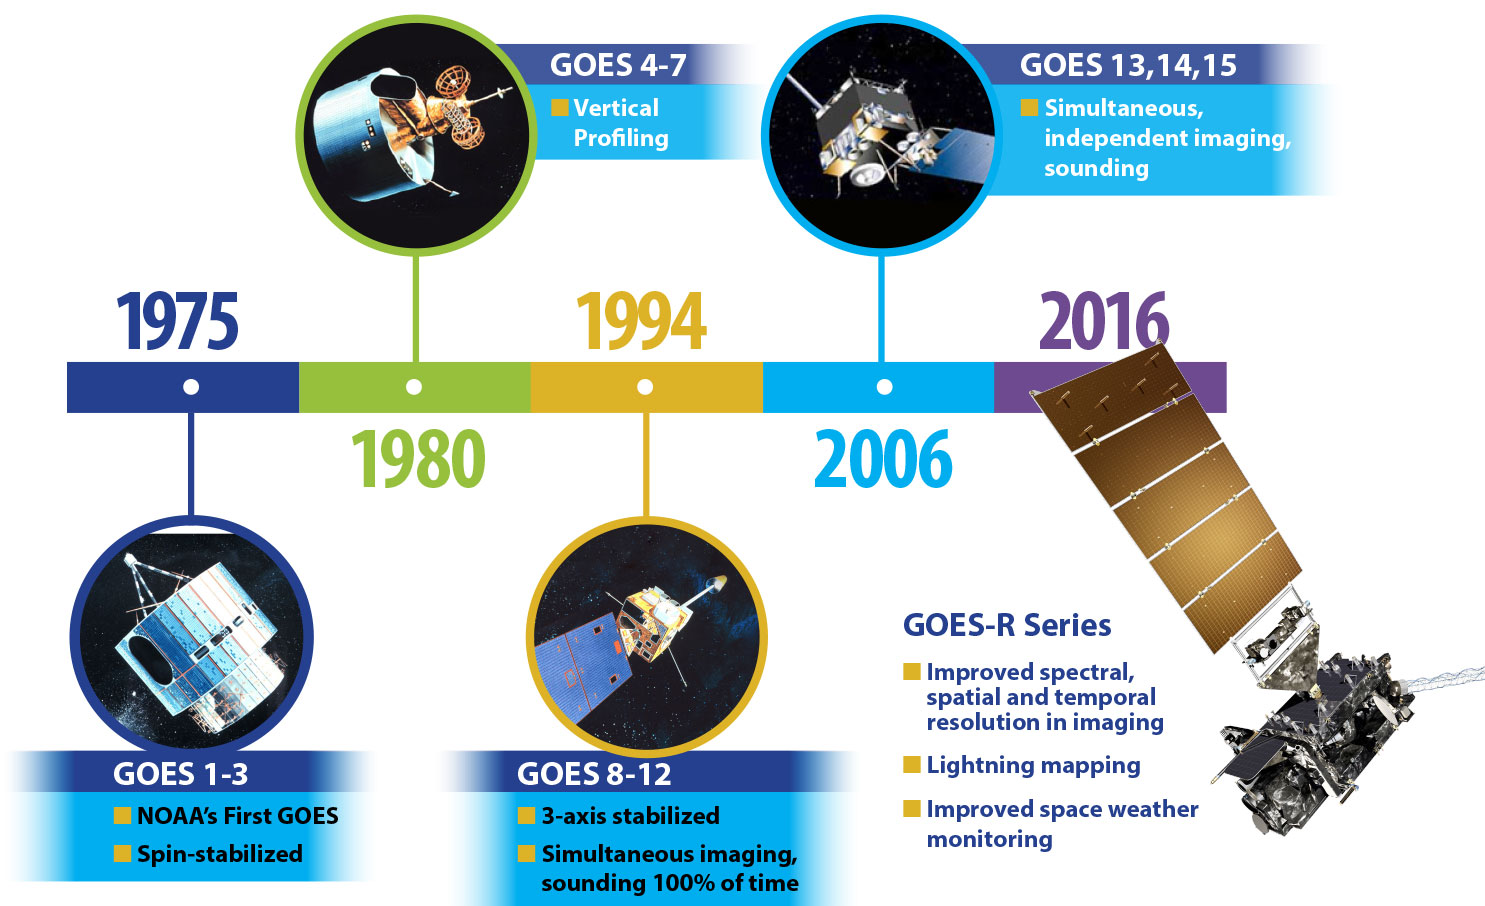
Satellite observations provide valuable information to meteorologists. The United States usually operates two geostationary satellites called GOES (Geostationary Operational Environmental Satellite). One has a good view of the East Coast; the other is focused on the West Coast. They are a basic element of the U.S. weather monitoring and forecasting enterprise. The first GOES satellite, GOES-1, was launched in October 1975. Upgrades to the instruments are made as needed and the U.S. is currently in the fifth generation of GOES satellites. These are the GOES-R series, first launched in 2016.
The current series of GOES provides advanced imagery and atmospheric measurements, real-time mapping of lightning activity, and monitoring of space weather. This is the Western Hemisphere’s most sophisticated weather-observing and environmental-monitoring system.
The procurement, design, and manufacture of GOES satellites is overseen by NASA, while NOAA is the official provider of both GOES terrestrial and space weather data. The most recent GOES satellite was launched June 25, 2024 and is currently undergoing post-launch check out. NOAA expects to see the first images from the new GOES-19 in September.
Steve Ackerman and Jonathan Martin, professors in the UW-Madison department of atmospheric and oceanic sciences, are guests on WHA radio (970 AM) at noon the last Monday of each month. Send them your questions at stevea@ssec.wisc.edu or jemarti1@wisc.edu.