On June 11, Environmental Protection Agency Administrator Lee Zeldin proposed repealing all “greenhouse gas” (their quotes, not ours) emission standards for the power sector under Section 111 of the Clean Air Act.
This proposal is based upon the false assertion that “emissions from fossil fuel-fired power plants do not contribute significantly to dangerous air pollution.” This assertion flies in the face of centuries of evolving understanding of the influence that carbon dioxide, the primary by-product of such combustion, has on the radiation balance of Earth’s atmosphere.
CO2 is one of several so-called greenhouse gases, all of which share the characteristic that they do not absorb visible radiation (the kind we can see and the predominant type of radiation emitted by the sun) but do absorb infra-red radiation (the kind emitted by the cooler surface of Earth, its oceans, and its inhabitants).
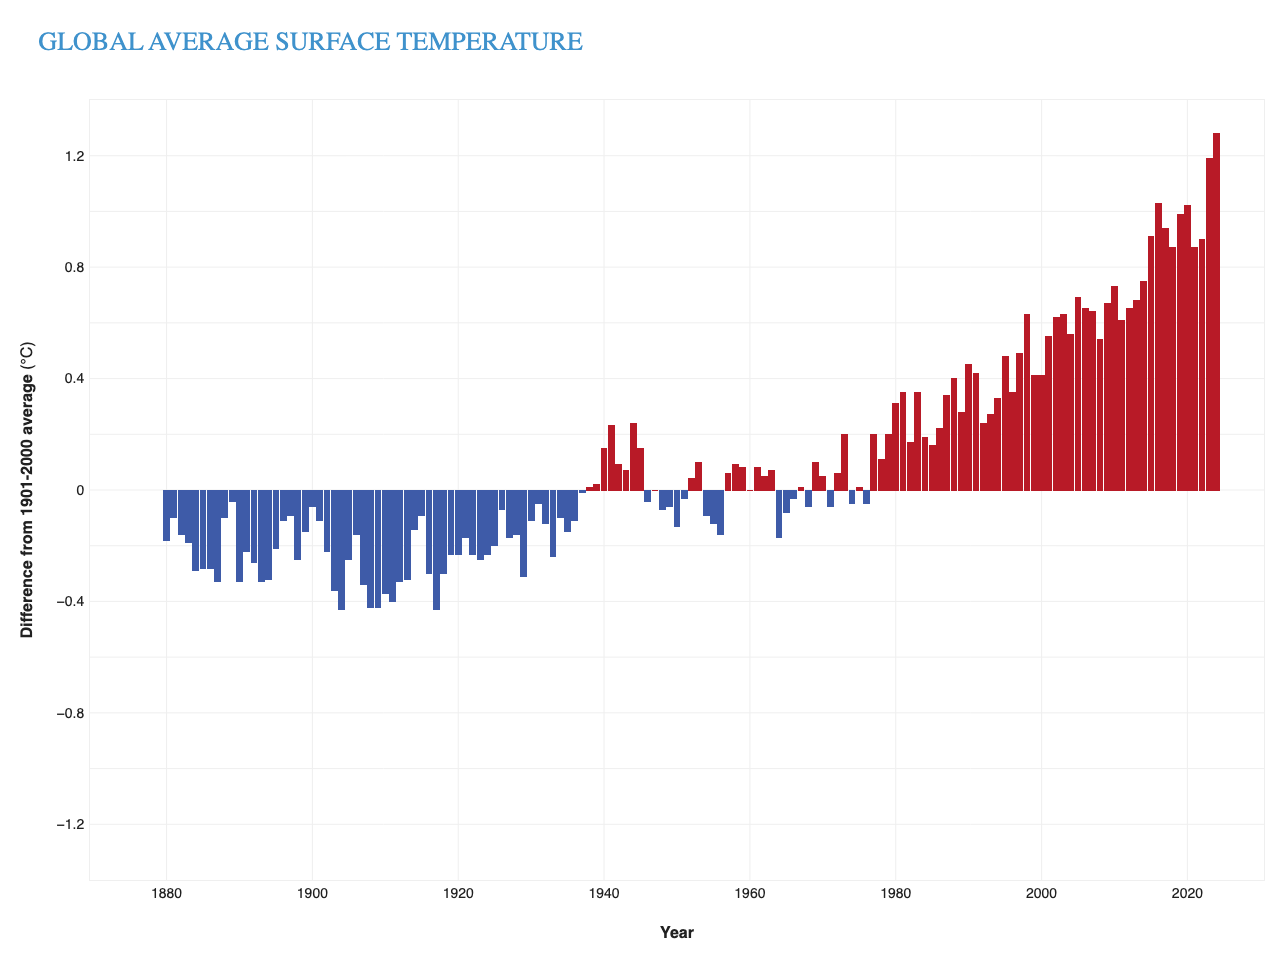
Over the last two centuries, industrialization has greatly increased the fraction of CO2 in our atmosphere and so has increased the planet’s temperature in what is known as global warming. There is absolutely no scientific dissent regarding the fact that an increased CO2 concentration in the atmosphere will have a warming effect — a conclusion that has been understood since the late 19th century.
Thus, the administration is willfully ignoring a robust scientific consensus on an issue that will continue to negatively impact our world and the world inherited by our children and grandchildren. Surely, they can’t believe that asserting a rule that irresponsibly ignores a festering problem will, by some miracle, simply eliminate the problem. You don’t have to be a scientist to be certain that that is not how nature works.
Steve Ackerman and Jonathan Martin, professors in the UW-Madison department of atmospheric and oceanic sciences, are guests on WHA radio (970 AM) at noon the last Monday of each month. Send them your questions at stevea@ssec.wisc.edu or jemarti1@wisc.edu.