The National Ocean and Atmosphere Administration’s National Climatic Data Center (or NCDC) calculates the average weather conditions over a 30-year period for more than 7,500 locations in the United States.
A reliable estimate of an average requires at least 30 years. These 30-year averages are referred to as the U.S. Climate Normal. They provide a baseline that allows everyone to compare a location’s current weather to the average weather that location would expect to see — whether a particular day’s temperature is cooler or warmer than normal, or if a particular month is wetter than normal.
Revised normals are computed every decade to account for the most recent 30 years of climate change. Over the past decade, the normals have been based on weather observations from 1981 to 2010. In early May, climate experts at NOAA issued an updated collection based on the weather occurring from 1991 to 2020.
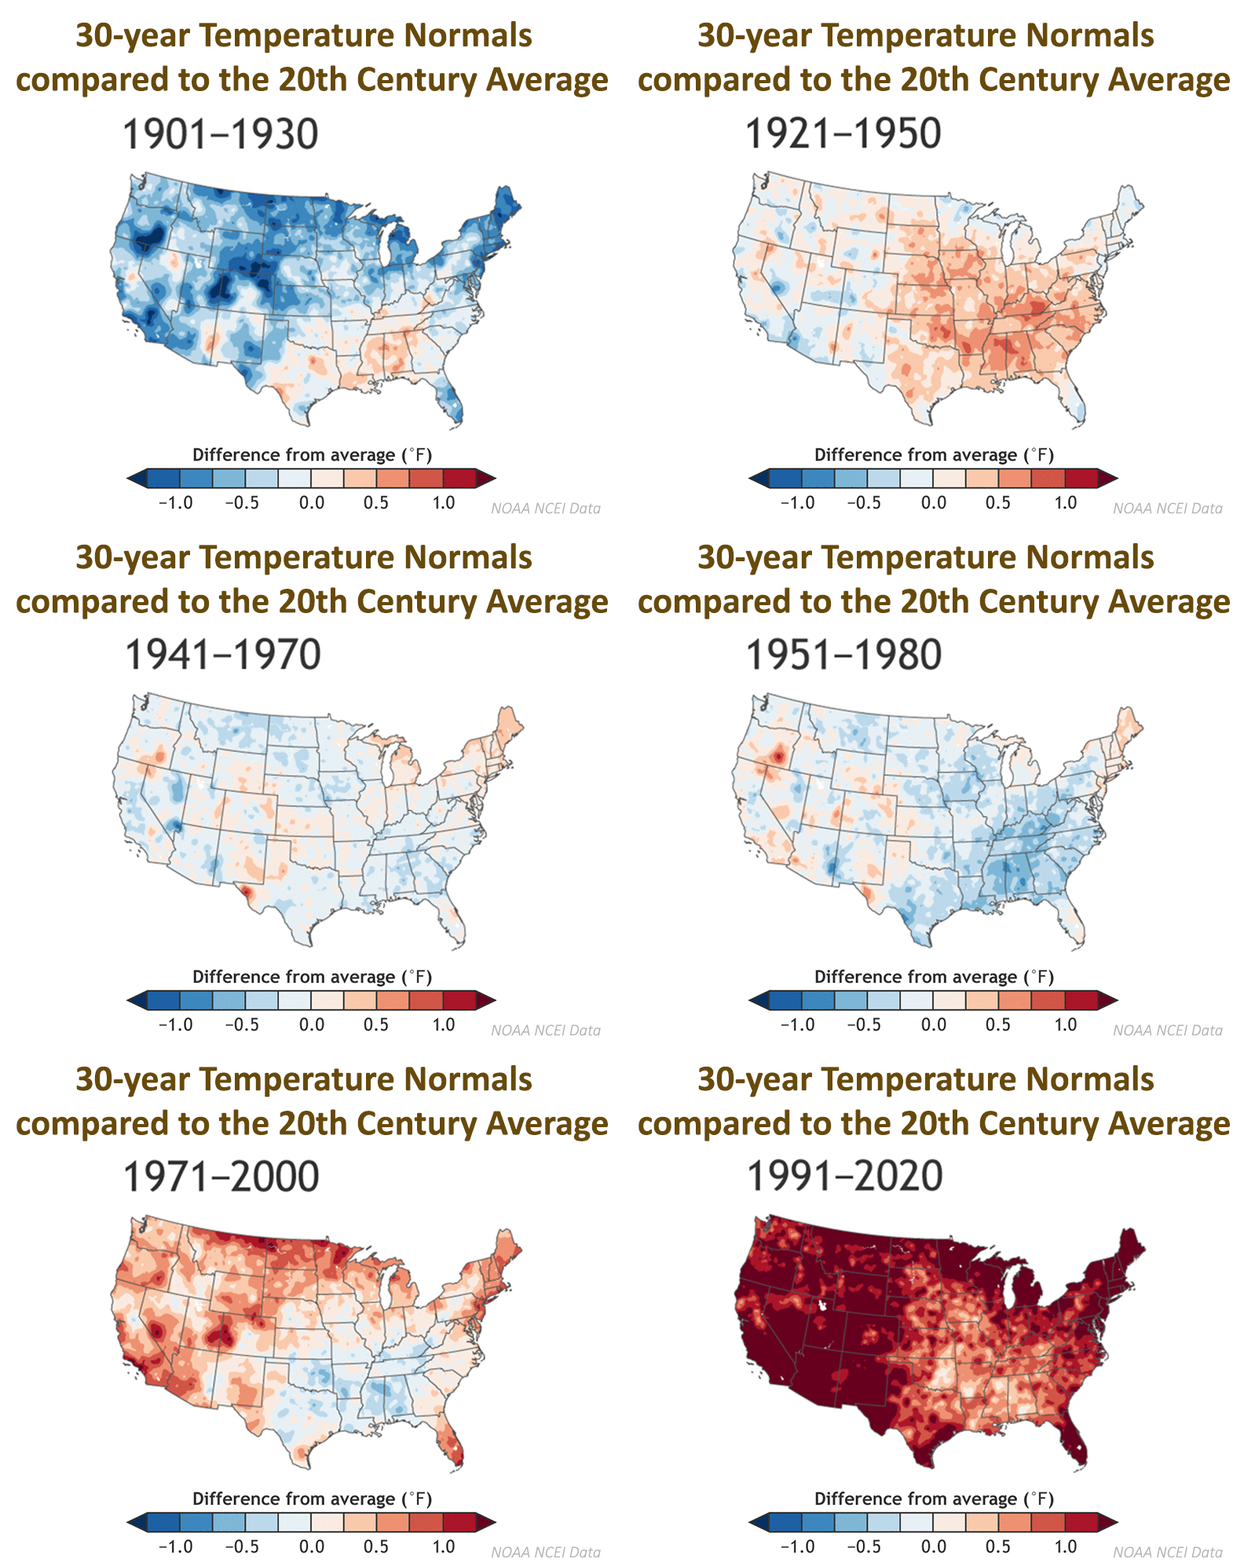
Scientists use the 20th-century average (1901-2000) to examine long-term climate trends. If we compare the 1991-2020 annual temperature normals to the 20th-century average, we see warming occurring across the U.S. No region is cooler in the past 30 years than it was during the 20th century. The nation’s midsection — from the Gulf of Mexico to the Great Lakes — did not warm as much as other parts of the country but saw a 5% to 15% increase in precipitation over the 20th-century average.
The new climate normals for Madison are warmer, wetter and snowier. The annual precipitation for Madison increased almost 3 inches, and the annual snowfall increased almost an inch. The average annual temperature went from 46.5 degrees to 47 degrees. Each season is warmer and wetter as well.
Steve Ackerman and Jonathan Martin, professors in the UW-Madison department of atmospheric and oceanic sciences, are guests on WHA radio (970 AM) at 11:45 a.m. the last Monday of each month. Send them your questions at stevea@ssec.wisc.edu or jemarti1@wisc.edu.


