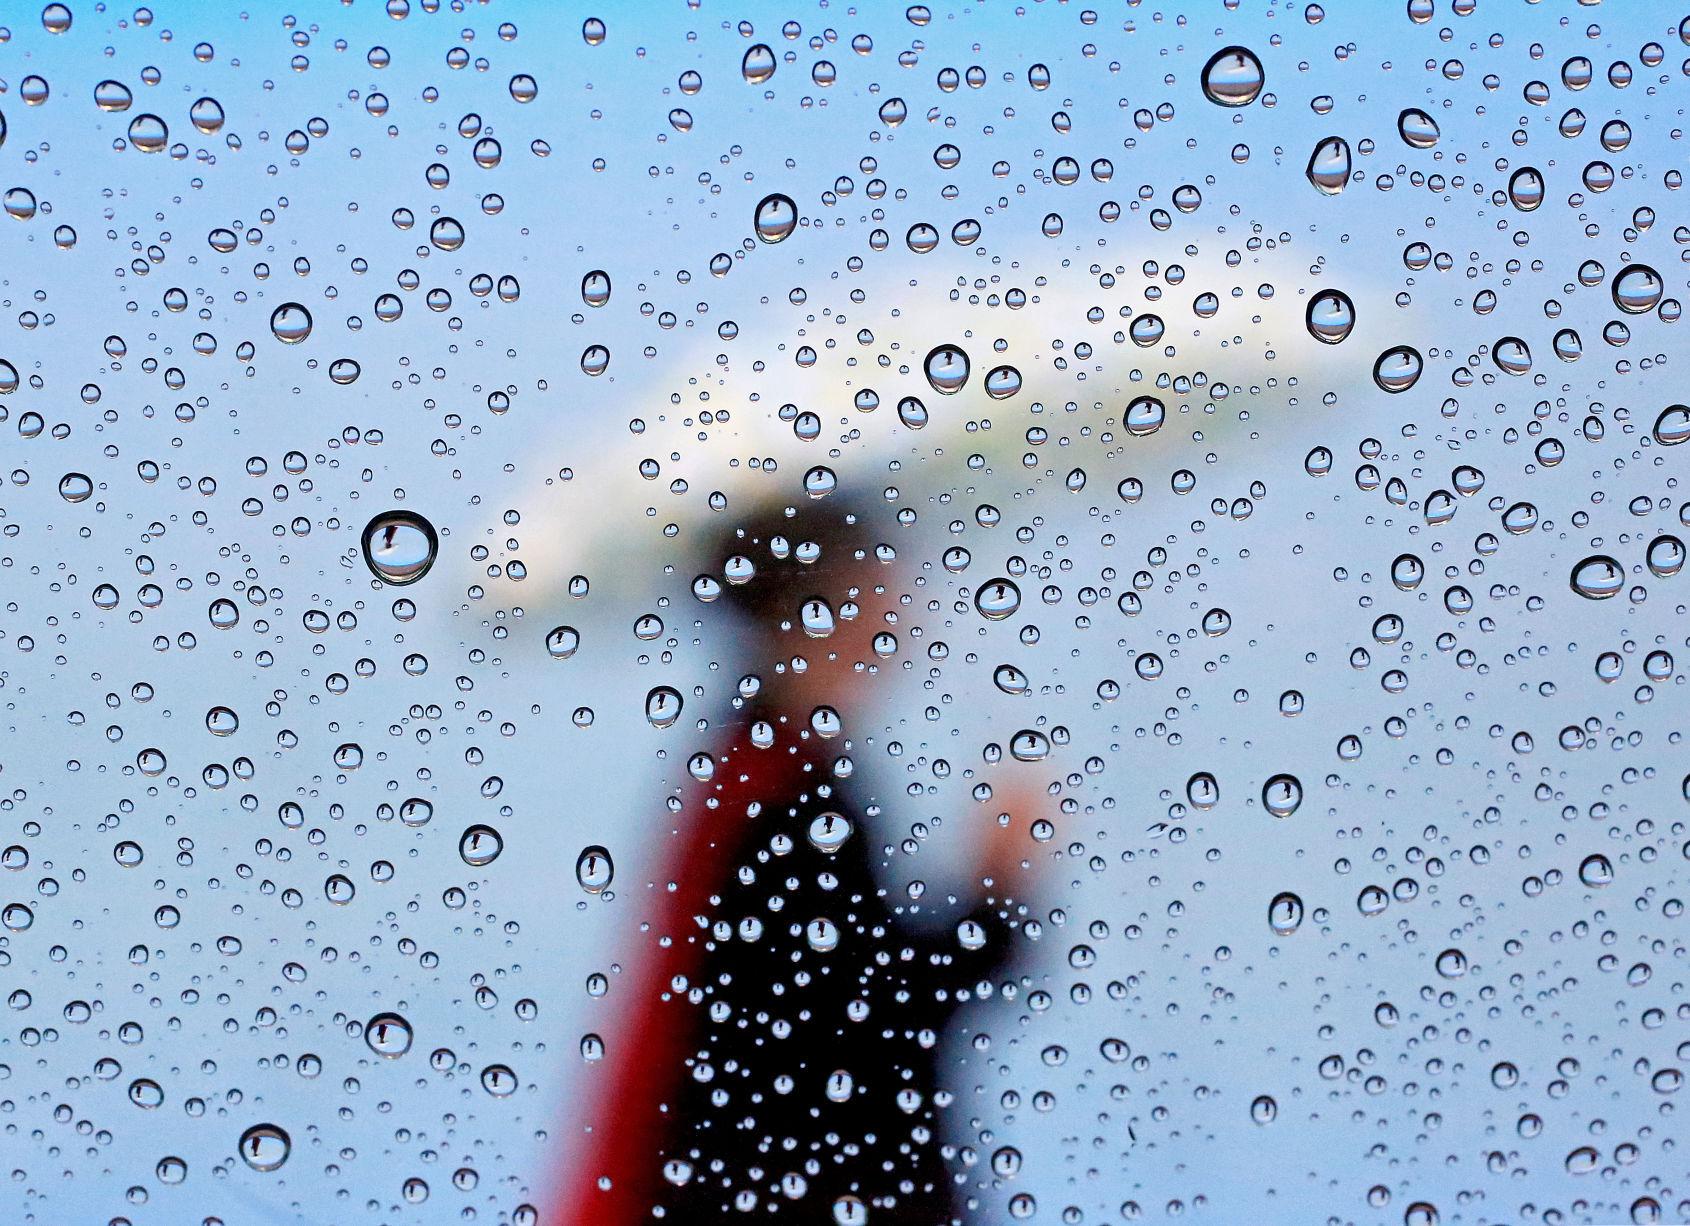
Raindrops on Earth are made of water. On Neptune, scientists suspect it rains pure carbon in the form of diamonds. (Photo credit: John Hart, State Journal Archives)
It does precipitate on other planets and moons in our solar system.
On Earth, when particles fall from clouds and reach the surface as precipitation, they do so primarily as rain, snow, freezing rain or sleet.
On the average, a raindrop is between 0.1 to 5 millimeters. Raindrops on Earth are made of water. Sometimes they can pick up pollen or dust suspended in the atmosphere as the rain falls towards the ground.
The rain on other planets has very different chemical compositions. On Venus, it rains sulfuric acid. On Mars it snows dry ice, which is carbon dioxide in a solid state. Saturn’s moon Titan rains methane and on Jupiter, it rains helium and mushy ammonia hailstones. On Neptune, scientists suspect it rains pure carbon in the form of diamonds.
A recent science study simulated the maximum size of liquid droplets that would fall as “rain” under the different planetary conditions. It is a fairly narrow size range, given the large variation in the gravity of the planets and moons involved. Raindrops that are too big break up into smaller ones, while raindrops that are too small evaporate before they hit the ground.
On Earth, the maximum raindrop size is about 7/16 of an inch, a similar size as on Saturn. The maximum raindrop size on Titan is about 1 and 3/16 inches, and on Jupiter the maximum size is about 9/32 of an inch.
While cartoonists typically draw raindrops in a teardrop or pear-shape, raindrops are not shaped in those forms. They are drawn as teardrops to give the image of falling through the atmosphere, which they do.
No matter the planet or moon, as raindrops fall they are flattened and shaped like a hamburger bun by the drag forces of the air they are falling through.
Steve Ackerman and Jonathan Martin, professors in the UW-Madison department of atmospheric and oceanic sciences, are guests on WHA radio (970 AM) at 11:45 a.m. the last Monday of each month. Send them your questions at stevea@ssec.wisc.edu or jemarti1@wisc.edu.
A firefighter with the Cal Fire Mendocino Unit walks along a containment line as a wildfire advances July 30, 2018, in Lakeport, Calif. A Red Flag Warning is issued when conditions may lead to especially dangerous wildfire growth. (Photo credit: Marco Jose Sanchez, Associated Press)
The National Weather Service issues, and cancels, fire weather watches (FWW), and red flag warnings (RFW) in coordination with the Wisconsin Department of Natural Resources and the U.S. Forest Service.
The weather service will not issue official warnings until certain threshold values, called red flag criteria, are forecast to occur. Red flag criteria differ from state to state. They usually include relative humidity values of 20% or less, winds of 20 mph or higher, and dry fuel conditions. Red Flag Warnings are usually only issued during the spring and fall fire weather seasons.
A Fire Weather Watch is issued 24 to 48 hours before the onset of red flag criteria. A Red Flag Warning is issued when red flag criteria are already occurring or will occur within the next 24 hours. The weather conditions under a Red Flag Warning may lead to especially dangerous wildfire growth. The warning alerts fire managers on federal and state lands that conditions are highly unfavorable for prescribed burns. Outdoor burning bans may be proclaimed by local law and fire agencies based on Red Flag Warnings.
The weather service will deploy specially trained forecasters to locations where large wildfires are active. These incident meteorologists, or IMETs, provide on-site weather support, including weather monitoring and daily fire weather briefings, to the command staff, firefighters and other incident personnel. Other atmospheric conditions can determine the danger of fire spread. For example, if the atmosphere is unstable, vertical movement of air tends to increase fire activity.
Steve Ackerman and Jonathan Martin, professors in the UW-Madison department of atmospheric and oceanic sciences, are guests on WHA radio (970 AM) at 11:45 a.m. the last Monday of each month. Send them your questions at stevea@ssec.wisc.edu or jemarti1@wisc.edu.
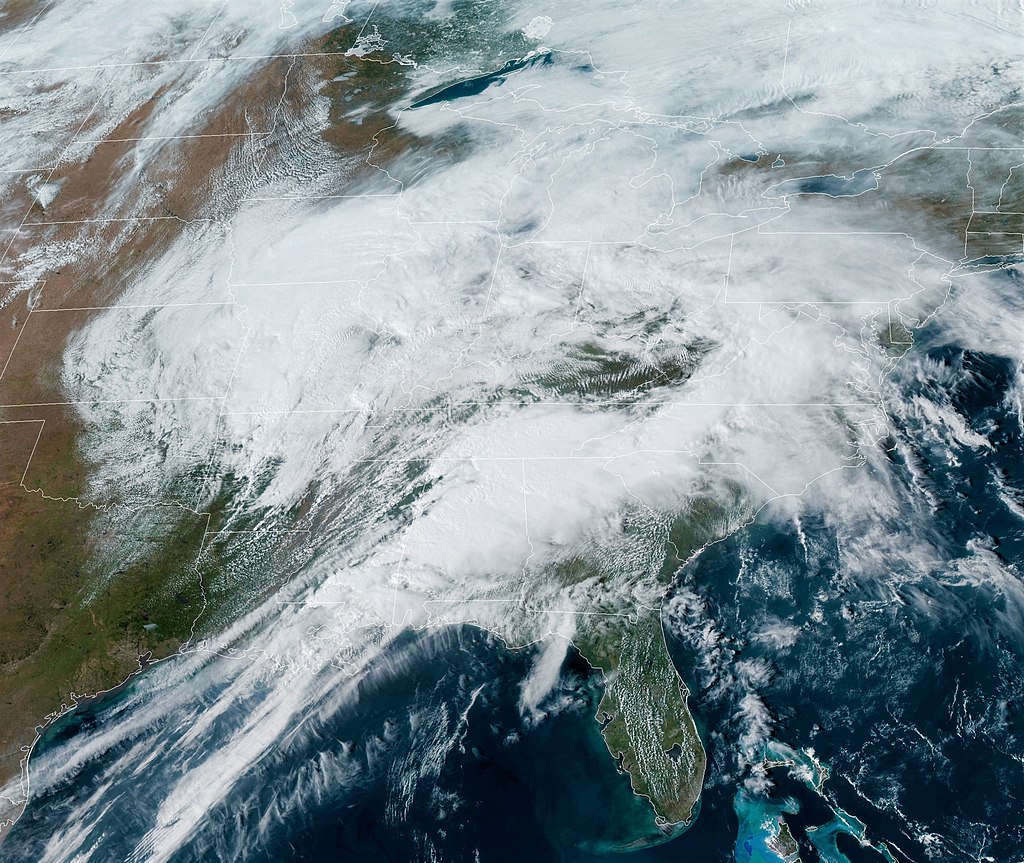
GOES East satellite Image of the storm system responsible for the Tornado Outbreak on March 25, 2021 (Photo credit: NOAA/NESDIS/STAR)
A deadly tornado outbreak took place Wednesday through Friday in the southern United States.
Tornadoes are classified based on the damage the tornado does, which enables us to estimate the wind speed of its rotating winds.
All tornadoes are assigned a single number from the Enhanced Fujita scale, abbreviated EF, according to the most intense damage caused by the storm.
This scale is based on the research of Ted Fujita and uses a set of 28 damage indicators to such structures as as barns, schools and trees. The degree of damage to each one is used to determine the EF scale number of every tornado.
The breakdown, and example damage, of the Enhanced Fujita scale is:
EF0
(weak): 65 to 85 mph; peels surface off some roofs; some damage to gutters or siding; branches broken off trees.
EF1
(weak): 86 to 110 mph; roofs severely stripped; mobile homes overturned or badly damaged; loss of exterior doors.
EF2
(strong): 111 to 135 mph; roofs torn off well-constructed houses; foundations of frame homes shifted; mobile homes destroyed.
EF3
(strong): 136 to 165 mph; severe damage to large buildings such as shopping malls; trains overturned; trees debarked; heavy cars lifted off the ground and thrown.
EF4
(violent): 166 to 199 mph; well-constructed houses and whole frame houses leveled.
We do not classify the strength of a tornado until experts assess the damage it did to the area.
No matter the classification, all tornadoes are dangerous. During last week’s tornado outbreak at least five fatalities have been confirmed due to an EF2 tornado with another death due to an EF4 tornado.
Steve Ackerman and Jonathan Martin, professors in the UW-Madison department of atmospheric and oceanic sciences, are guests on WHA radio (970 AM) at 11:45 a.m. the last Monday of each month. Send them your questions at stevea@ssec.wisc.edu or jemarti1@wisc.edu.
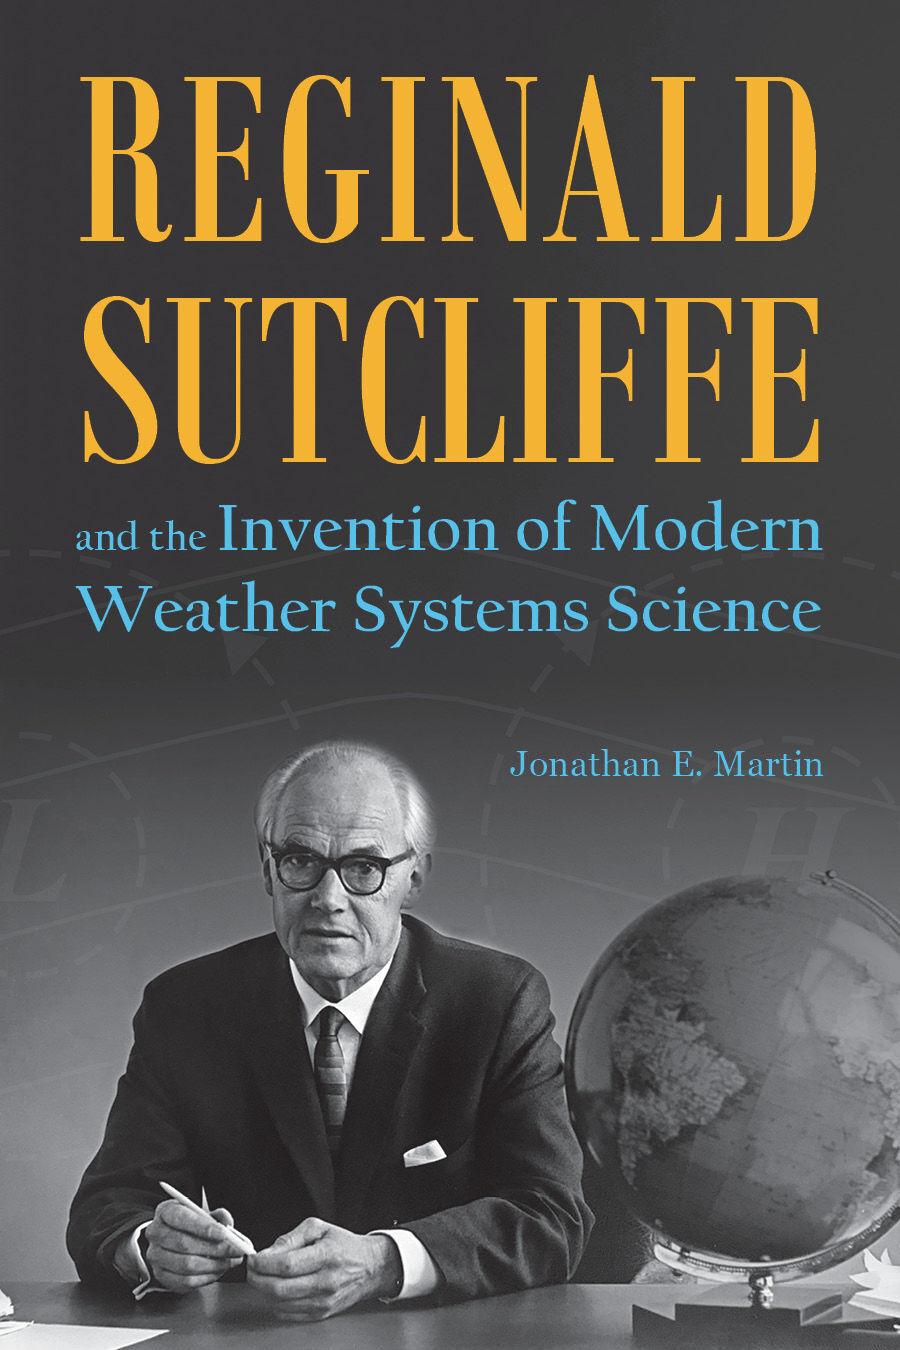
Jonathan Martin, half of the “Ask the Weather Guys” duo, wrote a book about the father of modern weather systems.
The technology that allows us to know the temperature, humidity and chance of precipitation on an hourly basis is something on which we’ve come to expect and rely. But ever wonder how the technology of predicting the weather came about?
UW-Madison professor Jonathan Martin, one of the writers of the State Journal’s “Ask the Weather Guys” column, answers that question in his new book “Reginald Sutcliffe and the Invention of Modern Weather Systems Science,” which came out March 15. He’ll be discussing the book during a virtual event through Mystery to Me bookstore later this month.
Q: Your biography is on Reginald Sutcliffe, who you credit as the father of our modern day weather predicting science, but start by telling me a little about yourself.
A: I’ve been at the University of Wisconsin-Madison since the fall of 1994, 27 years, in the same department, teaching about and researching aspects of the mid-latitude cyclone and how it connects to the climate system. Every fall I teach a class in mid-latitude weather systems where Sutcliffe made his major contributions. In the spring I most often teach an intro to weather and climate class
Q: Who was Reginald Sutcliffe?
A: I think it is fair to say that he is one of the giants in developing our modern understanding … of how weather systems really work. Until he came along knowledge was based entirely on observations of weather systems — known events of the past. Now it’s much more physically based. Sutcliffe was a giant in pulling that information out of the ether. The foundation of knowledge that he laid was essential in that revolution. In a way, he’s like a science Moses. He brought us to the promised land and never got there himself.
Q: What led Sutcliffe, who is British and lived from 1904 to 1991, to this revolution?
A: He was a Ph. D. mathematician who graduated in 1927. At the time, nearly all positions available for Ph.D mathematicians were jobs as teachers and he didn’t want to do that. He heard from the guidance office at the University of Leeds that the Meteorological Office tended to hire mathematician grads so he took a job with the Meteorological Office. … Through a series of very lucky coincidences he ended up being pushed in a direction where his initial frustration that meteorology was quite non-scientific was remedied by doing research work. … He was commissioned to write a textbook on meteorology for pilot training in 1938. This forced him to read extensively in meteorology and that reading led to an explosion of creativity.
Q: You mentioned he was not a strong believer in computers and their role in weather prediction, why not?
A: I think the reason he was never enthusiastic about numerical weather prediction was that in the initial 15 years of the development of using computers for forecasting, the computer generated forecasts were inferior to those made by experienced professional forecasters like Sutcliffe. It takes expert judgment to make sense of the vast amount of information available to make a reasonable statement of how the weather will evolve.
Q: How did you come to write this book?
A: A graduate professor of mine was a fan of Sutcliffe and thought he had some big insights. I hadn’t heard much about him as an undergrad. It wasn’t until I got the job in Wisconsin, 27 years ago this month, with my first task to prepare a class on mid-latitude cyclones for the fall of 1994, that I recognized him as such an important figure. As I put those notes together it occurred to me that Sutcliffe had his fingerprints on every single major insight that we have about such weather systems. I was touched by his genius.
Q: How does this biography compare to other books you’ve written?
A: I wrote one text book for the intro class and a much more substantial one for my senior level/graduate student course. For me, when you’re an academic, such textbooks can be seen as a logical extension of the professional obligation we all have at Wisconsin to teach and publish new discoveries about nature … we’re all obviously heavy into research. It’s nice to leave a legacy about how you understand things when you write a textbook. But to write a biography … that was a little out of the mainstream. It’s a different, and very exciting feel. I don’t take for granted how lucky I have been to undertake it and, to complete it, really made me proud.
Q: Do you want to do it again?
A: I think if the right subject came about and it was a feasible project. There is something really energizing about breathing life into something that may have been forgotten. Everybody looks at their phone to look at the weather. Some people are interested in why we’re able to do that — from where does that amazing capability arise. It’s because we’ve developed some really rigorous understandings about how the atmosphere works. We’re the first generation of humans to live in the presence of that miracle. I think I’m not the only one who thinks that is an interesting story.
Check it out
What: A virtual visit with author Jonathan E. Martin, whose book “Reginald Sutcliffe and the Invention of Modern Weather Systems Science,” came out earlier this month.
When: March 24 at 7 p.m.
For more information, visit: www.crowdcast.io/e/sutcliffe/register
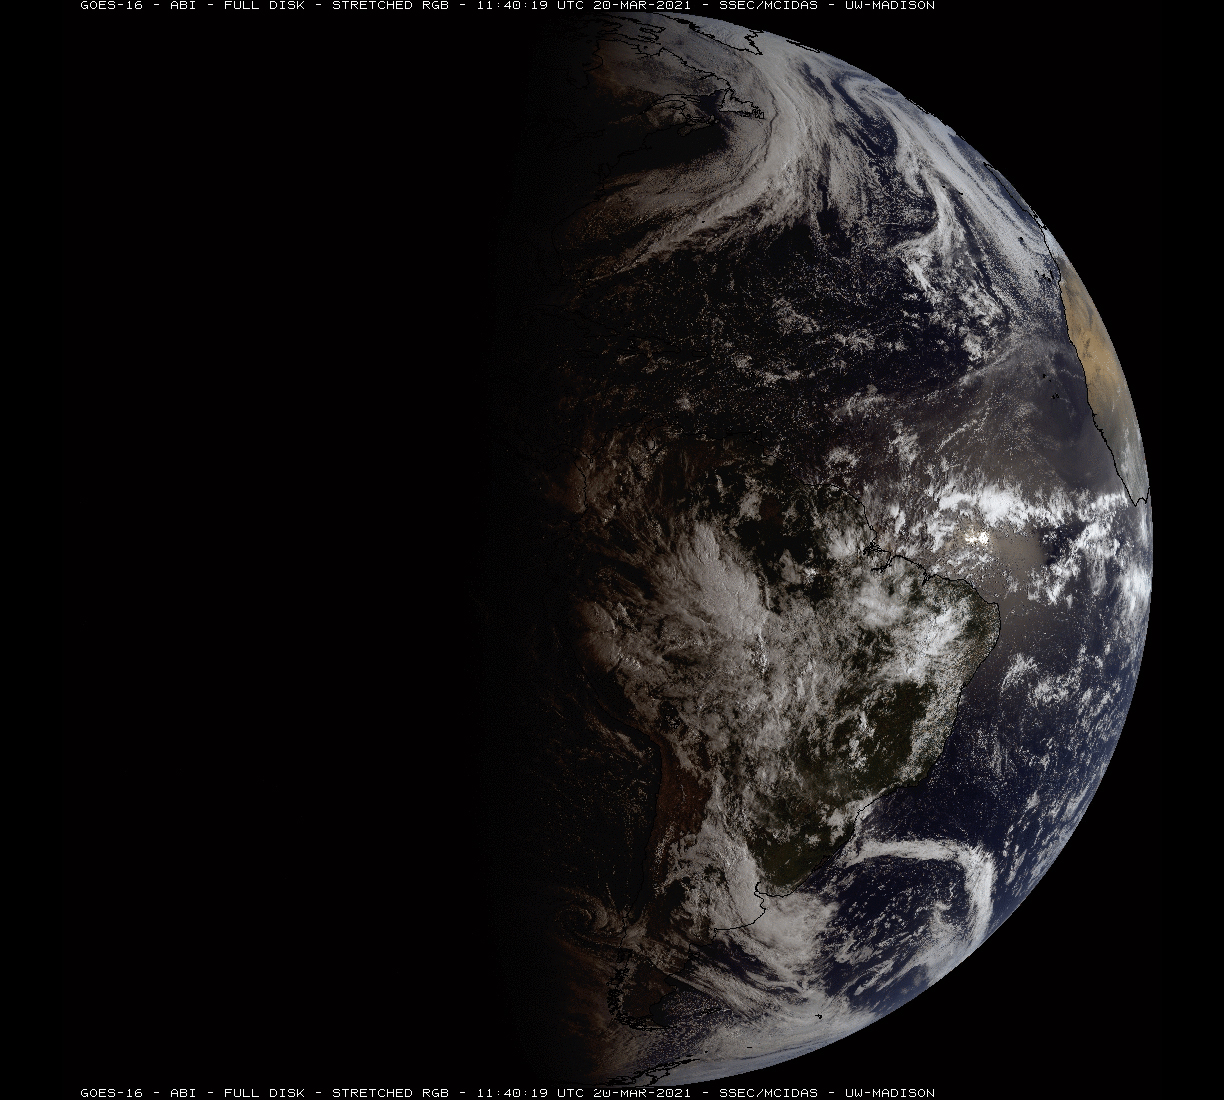
Satellite image illustrating equal daylight and nighttime on the Equinox.
The spring equinox — also called the vernal equinox — marks the beginning of the spring season in the Northern Hemisphere and the autumn season in the Southern Hemisphere.
This year the equinox arrived at 4:37 a.m. Saturday.
The equinoxes (equi for “equal,” and nox “night”) occur when the sun’s rays strike the equator at noon at an angle of 90 degrees. During the spring and fall equinoxes, the sun is above the horizon for all locations on Earth for 12 hours.
The fastest sunsets and sunrises of the year happen at the equinoxes. By fastest we mean the length of time it takes for the sun to sink below the horizon. At the equinoxes, the sun rises due east and sets due west, no matter where you live. If you live at the equator, the sun appears overhead at noon.
The tilt of the Earth’s axis is responsible for the seasonal variation in the amount of solar energy distributed at the top of the atmosphere. The Earth’s axis is tilted at an angle of 23.5 degrees from its orbital plane.
Because the Earth’s axis always points in the same direction — toward the North Star — the orientation of the Earth’s axis to the sun is always changing as the Earth orbits around the sun. As this orientation changes throughout the year, so does the distribution of sunlight on the Earth’s surface at any given latitude, and this is the cause of the seasons.
On the equinoxes the axis is not pointed at or away from the sun. This results in all areas experiencing a little more than 12 hours of daylight.
Steve Ackerman and Jonathan Martin, professors in the UW-Madison department of atmospheric and oceanic sciences, are guests on WHA radio (970 AM) at 11:45 a.m. the last Monday of each month. Send them your questions at stevea@ssec.wisc.edu or jemarti1@wisc.edu.