What a strange month January 2023 was in Madison.
The cloudiness was remarkably persistent and, though we don’t have a measurement of that variable for the month at hand, anecdotal assertions we have heard suggest that Madison got only about 8% of its possible January sunshine this past month.
Thanks to a major snow event the last weekend of the month, in which 7.3 inches of snow fell on Saturday and Sunday combined, we ended up at just about a normal amount for the month (13.9 inches was 0.2 inches above the average).
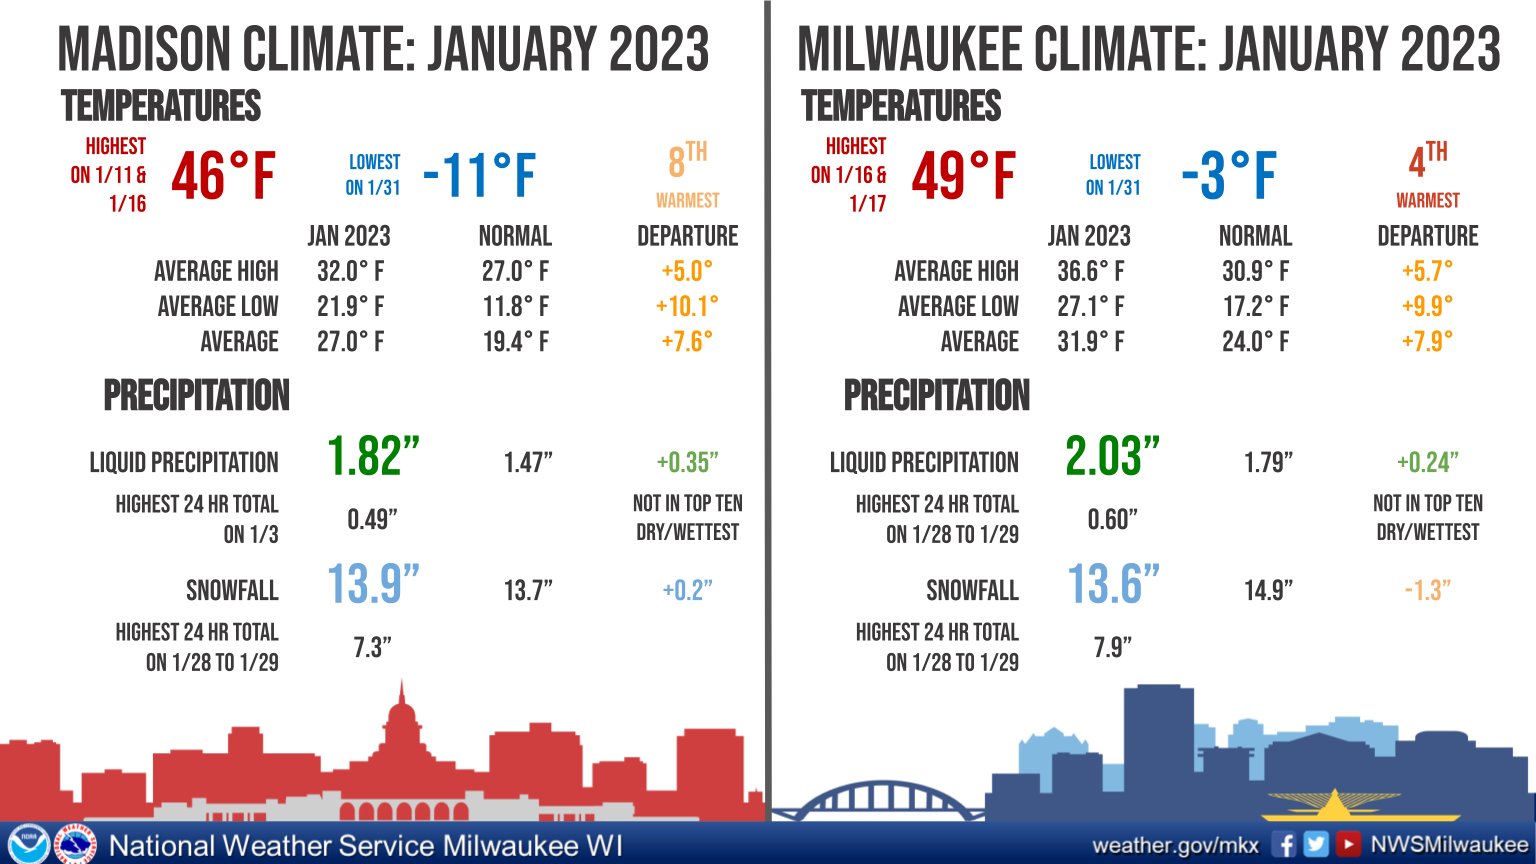
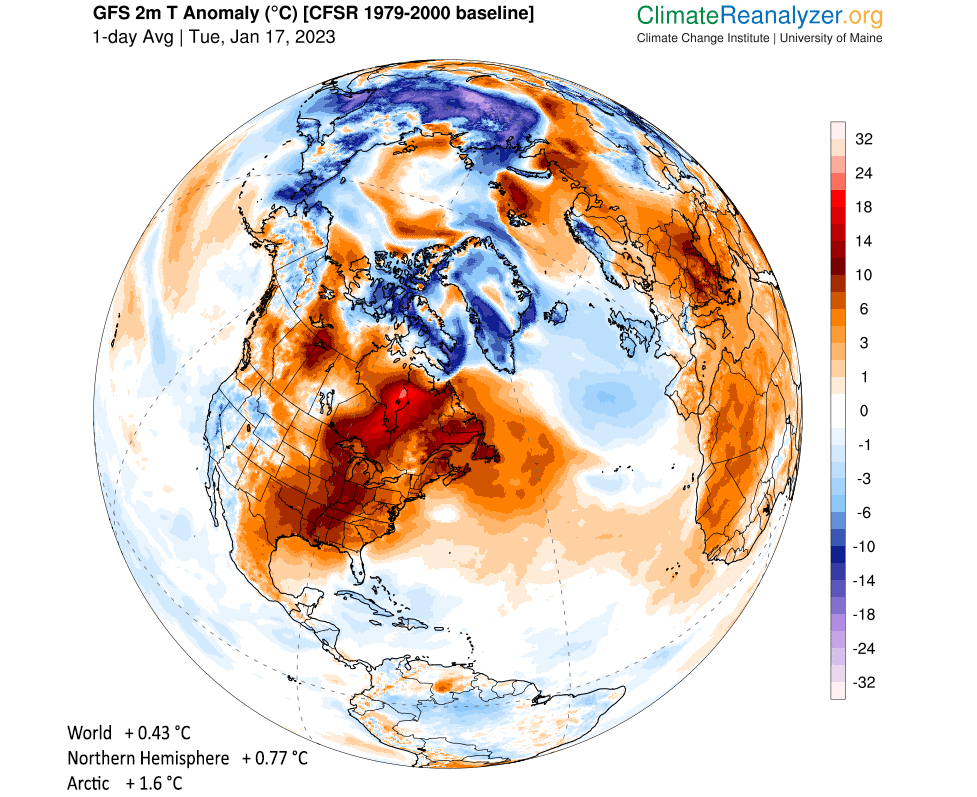
Of all the strange aspects to the last month, however, the strangest might just be the temperature. For almost the first four weeks of the month (that is, through Jan. 27) we averaged 10.53 degrees above normal — way out of line.
In fact, had we managed to remain at that pace we would have ended up with the third-warmest January ever recorded in Madison, behind January 2006 (plus 11 degrees) and 1933 (plus 10.7 degrees).
As it was, the snowstorm on Jan. 28 ushered in a fairly significant cold spell during which we recorded our coldest morning of the season at minus 11 on Jan. 31. We ended up at 7.3 degrees above normal for the month, which was still the eighth-warmest January ever in Madison. Milwaukee, at 7.9 degrees above its normal, recorded its fourth-warmest January ever.
Of course, none of this has much to say about what February might be like, but it is true that, climatologically at least, we have already been through our coldest week of the winter.
Steve Ackerman and Jonathan Martin, professors in the UW-Madison department of atmospheric and oceanic sciences, are guests on WHA radio (970 AM) at 11:45 a.m. the last Monday of each month. Send them your questions at stevea@ssec.wisc.edu or jemarti1@wisc.edu.