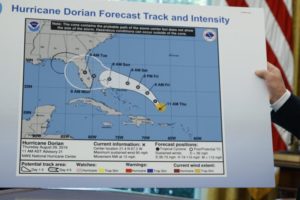
A hurricane map’s cone of uncertainty is developed from computer forecast models by the National Hurricane Center and shows the most likely path of a hurricane’s eye. President Donald Trump stirred controversy when he claimed that Hurricane Dorian could possibly threaten Alabama. (Photo credit: Evan Vucci, Associated Press)
Starting in the 1950s and up until the 1980s, meteorologists forecast the path of hurricanes using statistical prediction based on past data and current climatological data.
Today, weather computer models are primarily used for the forecasting.
The National Hurricane Center (NHC) issues 120-hour, 96-hour, 72-hour, 48-hour, 24-hour and 12-hour forecasts. The NHC forecasts include the hurricane track, intensity, size, along with rainfall and storm surge.
Once a hurricane has formed, scientists track the storm and predict its path using three- to five-day forecasts. Different models are used to predict the path of the hurricane. More than one model is used, as well as multiple forecasts from the same model with slightly different conditions.
The various hurricane forecast models create objective, computer-simulated predictions of a hurricane’s path and intensity. Each of these models will predict slightly different storm tracks.
The cone of uncertainty represents the probable track of the center of the hurricane, based on the models used to make the forecast. The cone represents the uncertainty in the forecast of the storm’s center, not necessarily the areas that will experience impacts.
The NHC produces many different graphic products and text messages each day. The graphics, including the cone of uncertainty, is used to communicate the model output to the public.
The cone of uncertainty should be used to get a rough idea of where the storm center may go, and the current wind watches and warnings for coastal areas.
The hurricane forecast models have improved, and continued improvements are expected. The track of the hurricane is better predicted than its intensity. Predicting the intensity accurately remains an outstanding challenge of meteorology.

